5. The Transportation System
This section provides a summary of the modes that collectively comprise the Ulster County transportation system including highways and streets, transit operations, and facilities for nonmotorized travel.
Highway System
Functional classification is a well-established system utilized by the Federal Highway Administration (FHWA) for grouping streets and highways into classes based on roadway characteristics and intended services. Functional classification defines the extent to which roadways provide for through-travel versus the extent to which they provide access to land parcels.
It is important to note that Rural Local streets which are not eligible for federal funds make up about 45% of the UCTC’s road mileage. NYSDOT, the New York State Thruway Authority (NYSTA), Ulster County, the City of Kingston, towns, and villages are responsible for maintaining and operating roadway facilities in Ulster County. The functional classification assists in allocating resources and investment for roadways across these agencies.
| Type | Number of Projects Pending or Underway | Amount of Development |
|---|---|---|
| Commercial (Office/Retail) | 8 | 102,500 square feet |
| Hotel/Lodging | 9 | 732 hotel rooms/units |
| Industrial | 4 | 890,500 square feet |
| Mixed Use (residential/hotel/commercial) | 11 | 2,339 residential units; 532 hotel rooms/units; 949,000 square feet commercial space |
| Residential | 23 | 2,270 residential units |
| Recreational | 1 | 77,000 square feet |
Roadway Asset Condition
Pavement condition is measured in two ways in New York. The first is surface condition, as measured through a visual scoring methodology. The second measure is ride-ability, as measured by the International Roughness Index (IRI). This is a more user-based metric. NYSDOT typically uses both methods to evaluate State highway system pavements as well as other federal-aid eligible roadways under local jurisdiction.
Bridge Ownership
The Ulster County transportation system includes 393 functional bridges; 39% are county-owned structures, 28% are NYSDOT-owned structures, and 20% are locally-owned.
Bridge Condition
Federal law requires that all bridges be inspected biennially; those that have specific structural problems may require more frequent inspections. Inspections include evaluation and rating of numerous elements of the substructure, superstructure, and deck, with special attention paid to fracture-critical members. Underwater inspections occur no less than every 5 years to check for scour around bridge piers.
Intersection Traffic Control
Traffic signals are a key element of traffic control. Their location and timing affect the mobility of vehicles and pedestrians. National studies demonstrate that poorly timed traffic signals are responsible for a significant proportion of urban traffic congestion. Signal timing that does not allow sufficient time for pedestrians to cross a street can contribute to safety problems and act as a barrier to walking. One solution is to install Leading Pedestrian Intervals, or LPIs, which give pedestrians the opportunity to enter the crosswalk at an intersection before vehicles are given the green light. This treatment, which has been shown to reduce pedestrian-vehicle crashes at intersections by 13%.
In 2019, UCTC conducted a systemic evaluation of traffic conditions associated with 12 signalized intersections suspected to no longer meet the minimum traffic and safety warrants. Eleven intersections were found to not meet any of the criteria required for a traffic signal to be installed. The City of Kingston Department of Public Works has since removed the outdated and unwarranted signals and will monitor each location to ensure safe and efficient traffic operations. In addition to evaluating the necessity of traffic signals, the City of Kingston has undertaken several projects to improve the efficiency and safety of existing traffic signals.
Beyond traffic signals, Ulster County has been actively incorporating roundabouts into its infrastructure plans to address traffic flow and safety issues.
Travel on the Roadway System
Critical Corridors
One way to view the roadway system is in terms of corridors. Critical corridors are those that serve major population centers including future growth areas; carry higher volumes of through traffic; carry higher volumes of freight movement; and serve primary economic generators, including recreational venues as well as traditional businesses.
Regional Commutation
The TMA region’s workforce as a whole is on the move. While a large percentage of the workforce leave Ulster County every day (56%), both Dutchess (55%) and Orange (55%) experience similar commutation patterns. These flows have considerable impact on congestion and drive investments in transit, park- and-ride facilities, and corridor improvements.
Transit System
Public transportation provides mobility to those unable to drive –“captive riders”, including young people, senior citizens, those with disabilities — and drivers who cannot afford to own a car. An efficient transit system also captures “choice riders” – those that choose to travel by bus. Taken together, these transit trips offer an environmental benefit compared to automobile trips through reduced fuel use and pollution and reduced congestion in heavily traveled corridors.
Ulster County Area Transit (UCAT) presently operates a total 11 scheduled fixed routes throughout Ulster County and three specialty routes. UCAT also offers rural route services by request to passengers in the rural areas of the county. Passengers who are 60 years or older and registered with the Office for Aging are eligible for one round trip for shopping and two round trips for medical service per week free on the UCAT system or the Office for Aging medical van. UCAT is currently partnering with UCTC to study how the existing UCAT system can be transformed to better serve the public.
System Use
Since the pandemic, ridership has steadily increased with a slight uptick in rate of recovery following the shift to a fare-free system in October 2022. In fact, towards the latter half of 2024, ridership began exceeding the pre-pandemic peak. Since then, ridership has only continued to climb, with over 280,000 passenger trips provided in the first six months of 2025, a 12% increase over the number of passenger trips provided in the first half of 2024.
Inter-City Bus
Ulster County is also served by intercity bus carrier Adirondack Trailways. A majority of their operations provide access to a number of destinations outside the county and are used by a significant number of commuters traveling to the New York City metropolitan area.
Active Transportation
For this iteration of the LRTP, UCTC is transitioning from a non-motorized approach to a more comprehensive active transportation plan. Instead of focusing on walking and biking alone, this plan addresses growing E-bike ridership and other emerging micromobility opportunities – such as bike share systems throughout the region. Since the statewide legalization of a 3-class framework for e-bikes in 2020, micromobility (including e-scooters and e-bikes) has expanded throughout the county. First and last mile connections with public transit represents another opportunity to support multimodal transportation.
Walking
Pedestrian Safety
Pedestrian crashes sharply decreased to a 10-year low in 2020 at the onset of the COVID-19 pandemic, but began to rise again after 2022 consistent with statewide trends.
Infrastructure and Design
UCTC maintains and is in the process of adding to a county-wide inventory of sidewalks which includes nearly 115 miles of sidewalks across 24 communities and includes information on sidewalk material and condition. Many jurisdictions throughout the County require individual property owners to maintain their sidewalks, which can create an inconsistent surface, and accessibility barriers, particularly for persons with disabilities or limited mobility. The abundance of state-operated roadways throughout Ulster County communities – particularly in denser commercial areas – creates jurisdictional barriers to implementing street designs more conducive to bicycle and pedestrian safety.
Bicycling and Micromobility
Bicycle Safety
Bicycle crashes generally declined between 2017 and 2020 with a slight increase in 2021, followed by a peak 10-year low in 2022. Crashes then increased significantly to their highest levels since 2014.
Micromobility
Since their statewide legalization in 2020, Ulster County has seen an increase in the volume of e-bikes on regional trails and local corridors. The new law established a three-tiered classification framework for e-bikes, and legalized the use of most types of e-bikes on state roadways with a speed limit of 30 MPH or less. The law also empowers local municipalities to self-regulate e-bikes within their jurisdiction. Several municipalities are currently utilizing grants through the New York State Energy Research and Development Authority (NYSERDA)’s Clean Mobility Program to explore micromobility opportunities.
Active Transportation Infrastructure Expansion
Ulster County hosts a variety of regional facilities to support bicycle mobility in tandem with other modes of active transportation. In addition to these trails with regional scope, many communities throughout Ulster County are working to expand facilities to support bicycle mobility. NYSDOT has several designated bike routes that run through Ulster County. While designated as bike routes, these corridors have inconsistent designs offering little in the way of protection for cyclists.
Planning the Future of Active Transportation
Active Transportation will continue to grow and serve a vital role in the regional transportation system. Looking to the future of bicycling, walking and micromobility, UCTC will continue to support active transportation infrastructure, programs and policies across the following categories:
- Develop an Active Transportation Plan as an update to the 2008 Ulster County Non-Motorized Transportation Plan.
- Improving amenities within the existing network.
- Addressing gaps and optimizing the existing active transportation system.
- Expanding connectivity to communities outside the active transportation system.
- Planning for an expansion of micromobility.
- Promoting local Complete Street improvements in communities throughout Ulster County.
Modal Split: How People Travel
Auto Ownership
According to the 2023 ACS, approximately 92.5% of Ulster County households have access to one or more vehicles. The high accessibility of vehicles contributes to the high volume of drive-alone commuting by Ulster County residents. Ownership rates are much lower in urbanized areas.
System-wide Safety
The major safety goals of this plan are to reduce fatalities and serious injuries in the UCTC planning area, in line with FHWA’s Safe System Approach. Strategies to address safety, security, public health and other risks are key to achieving this goal, as well as others.
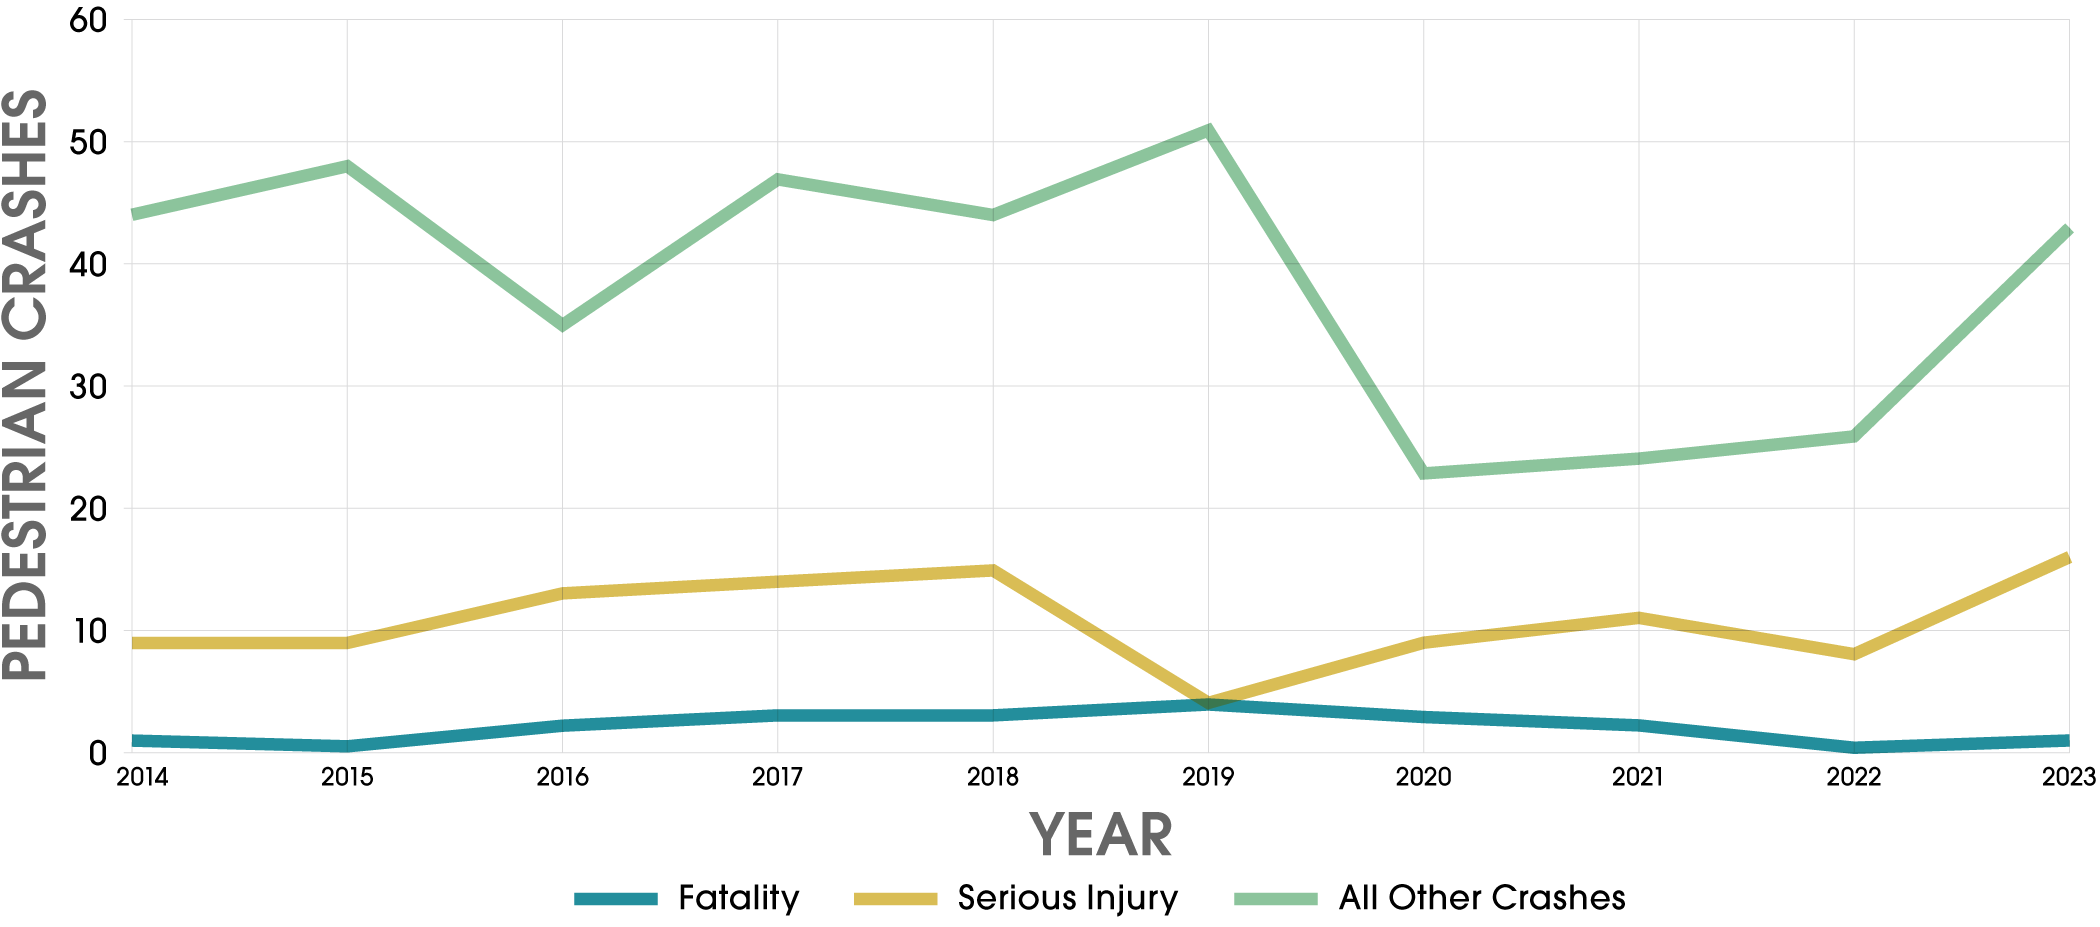
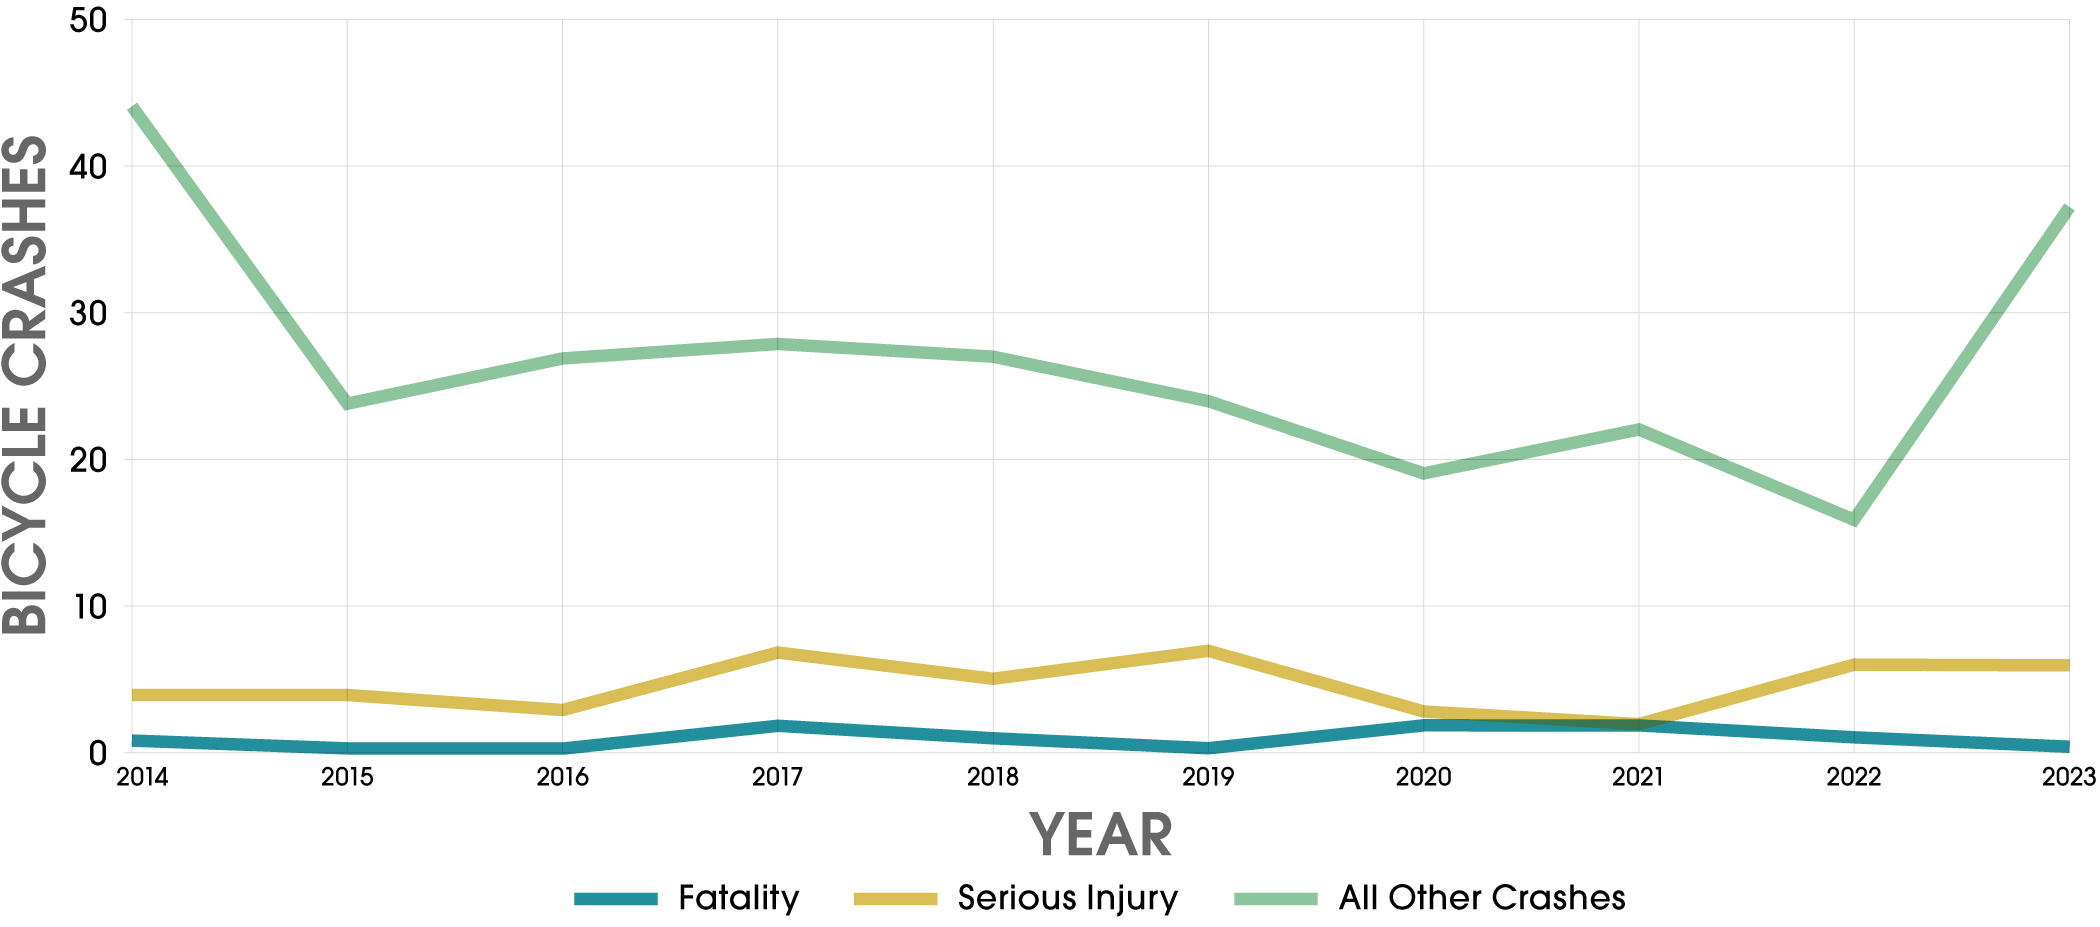
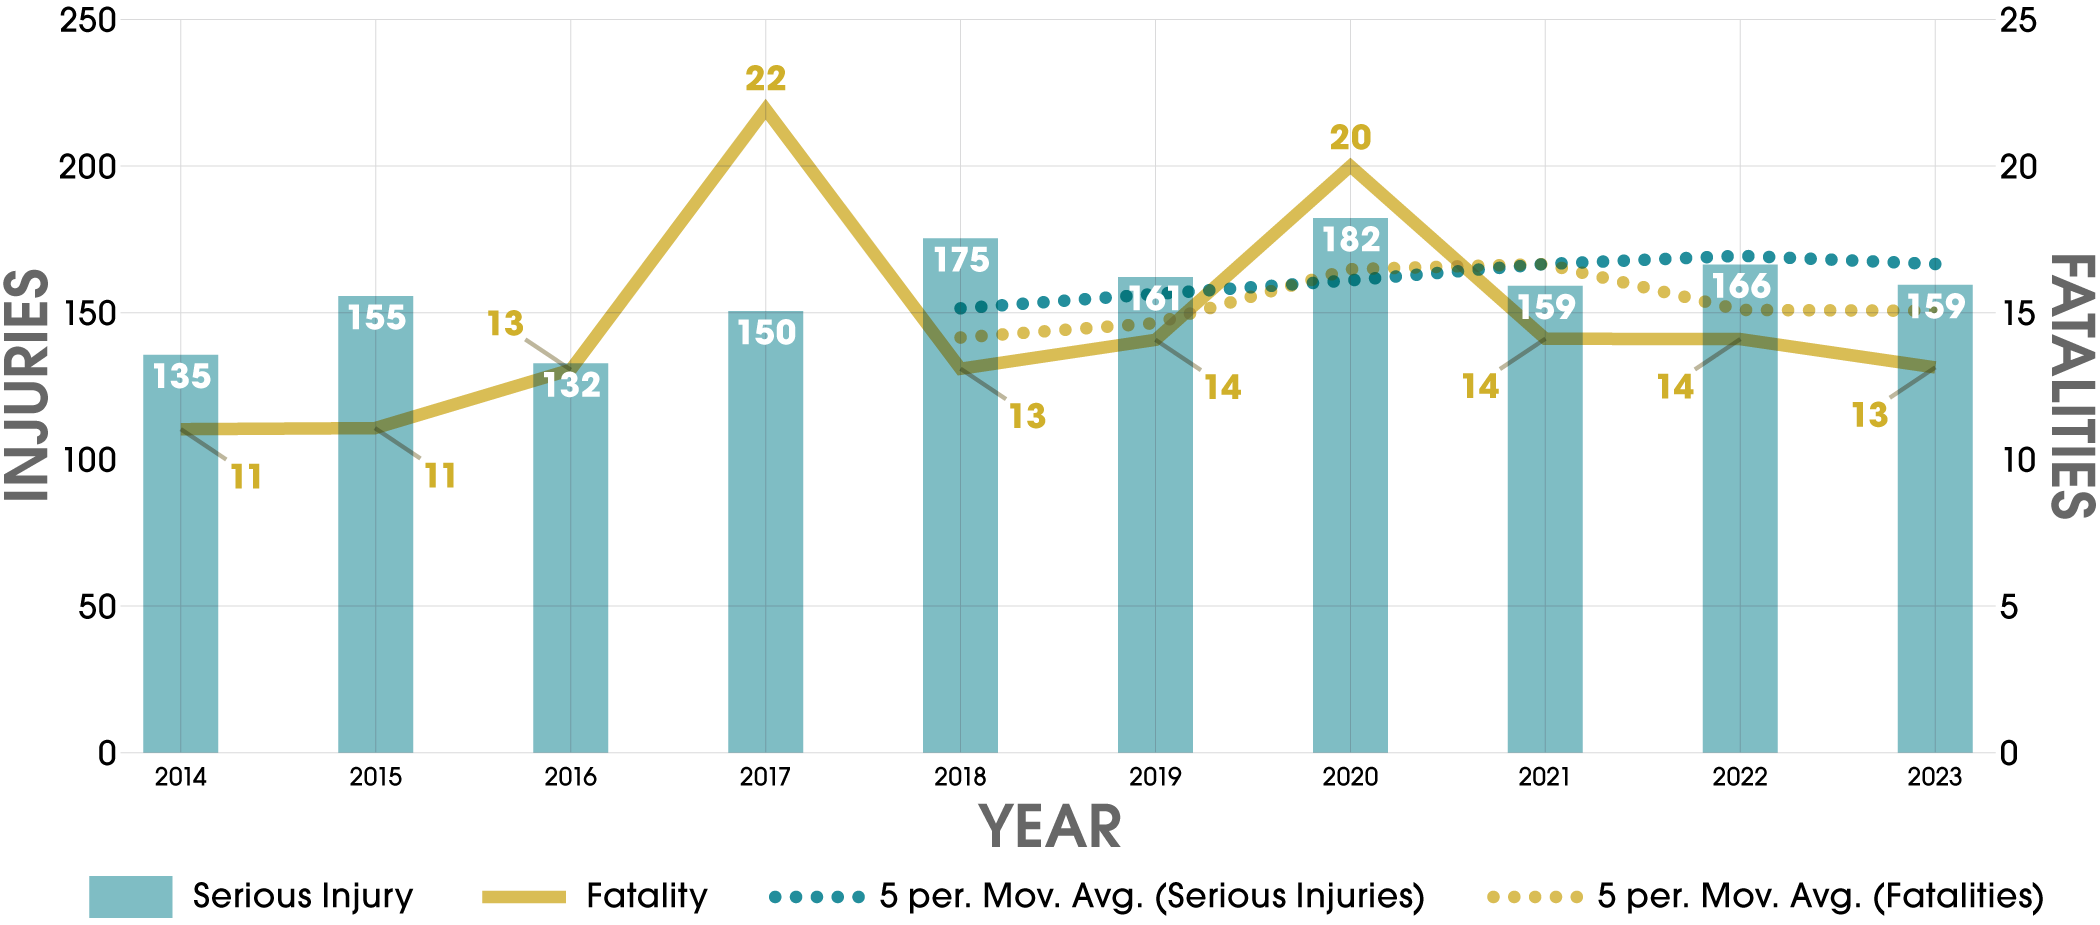
Serious Injuries and fatalities generally increased between 2014 and 2018 and have stayed relatively steady from 2019 to 2023.
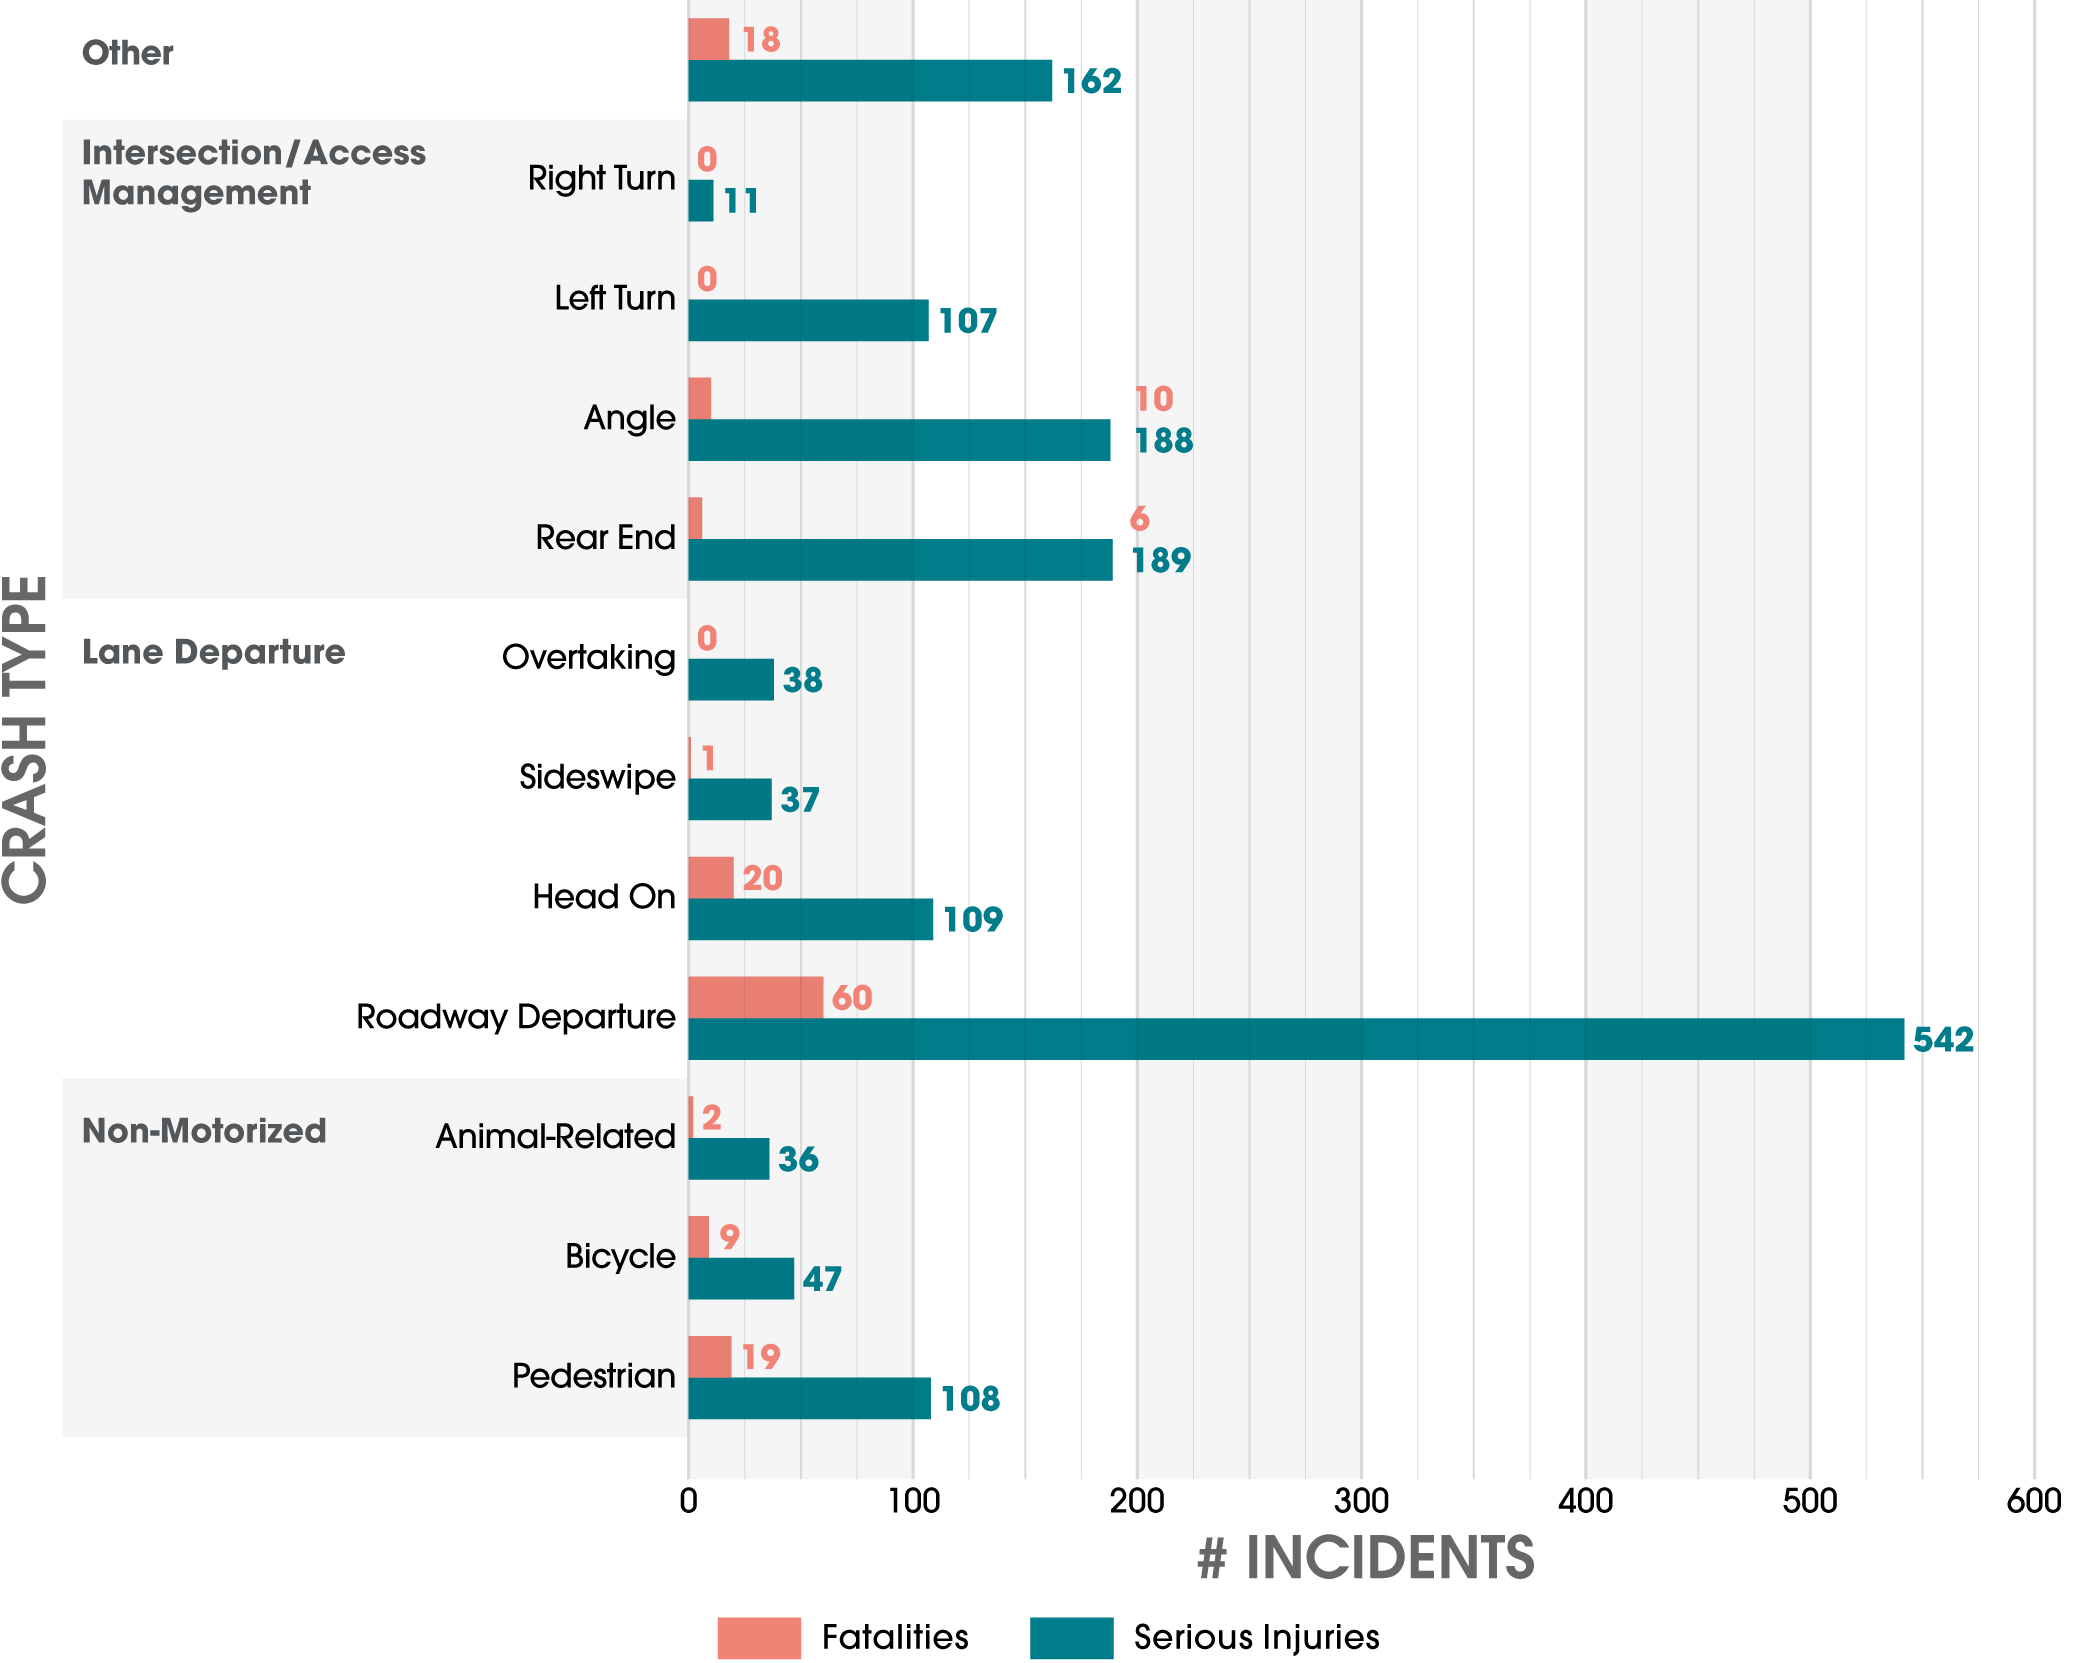
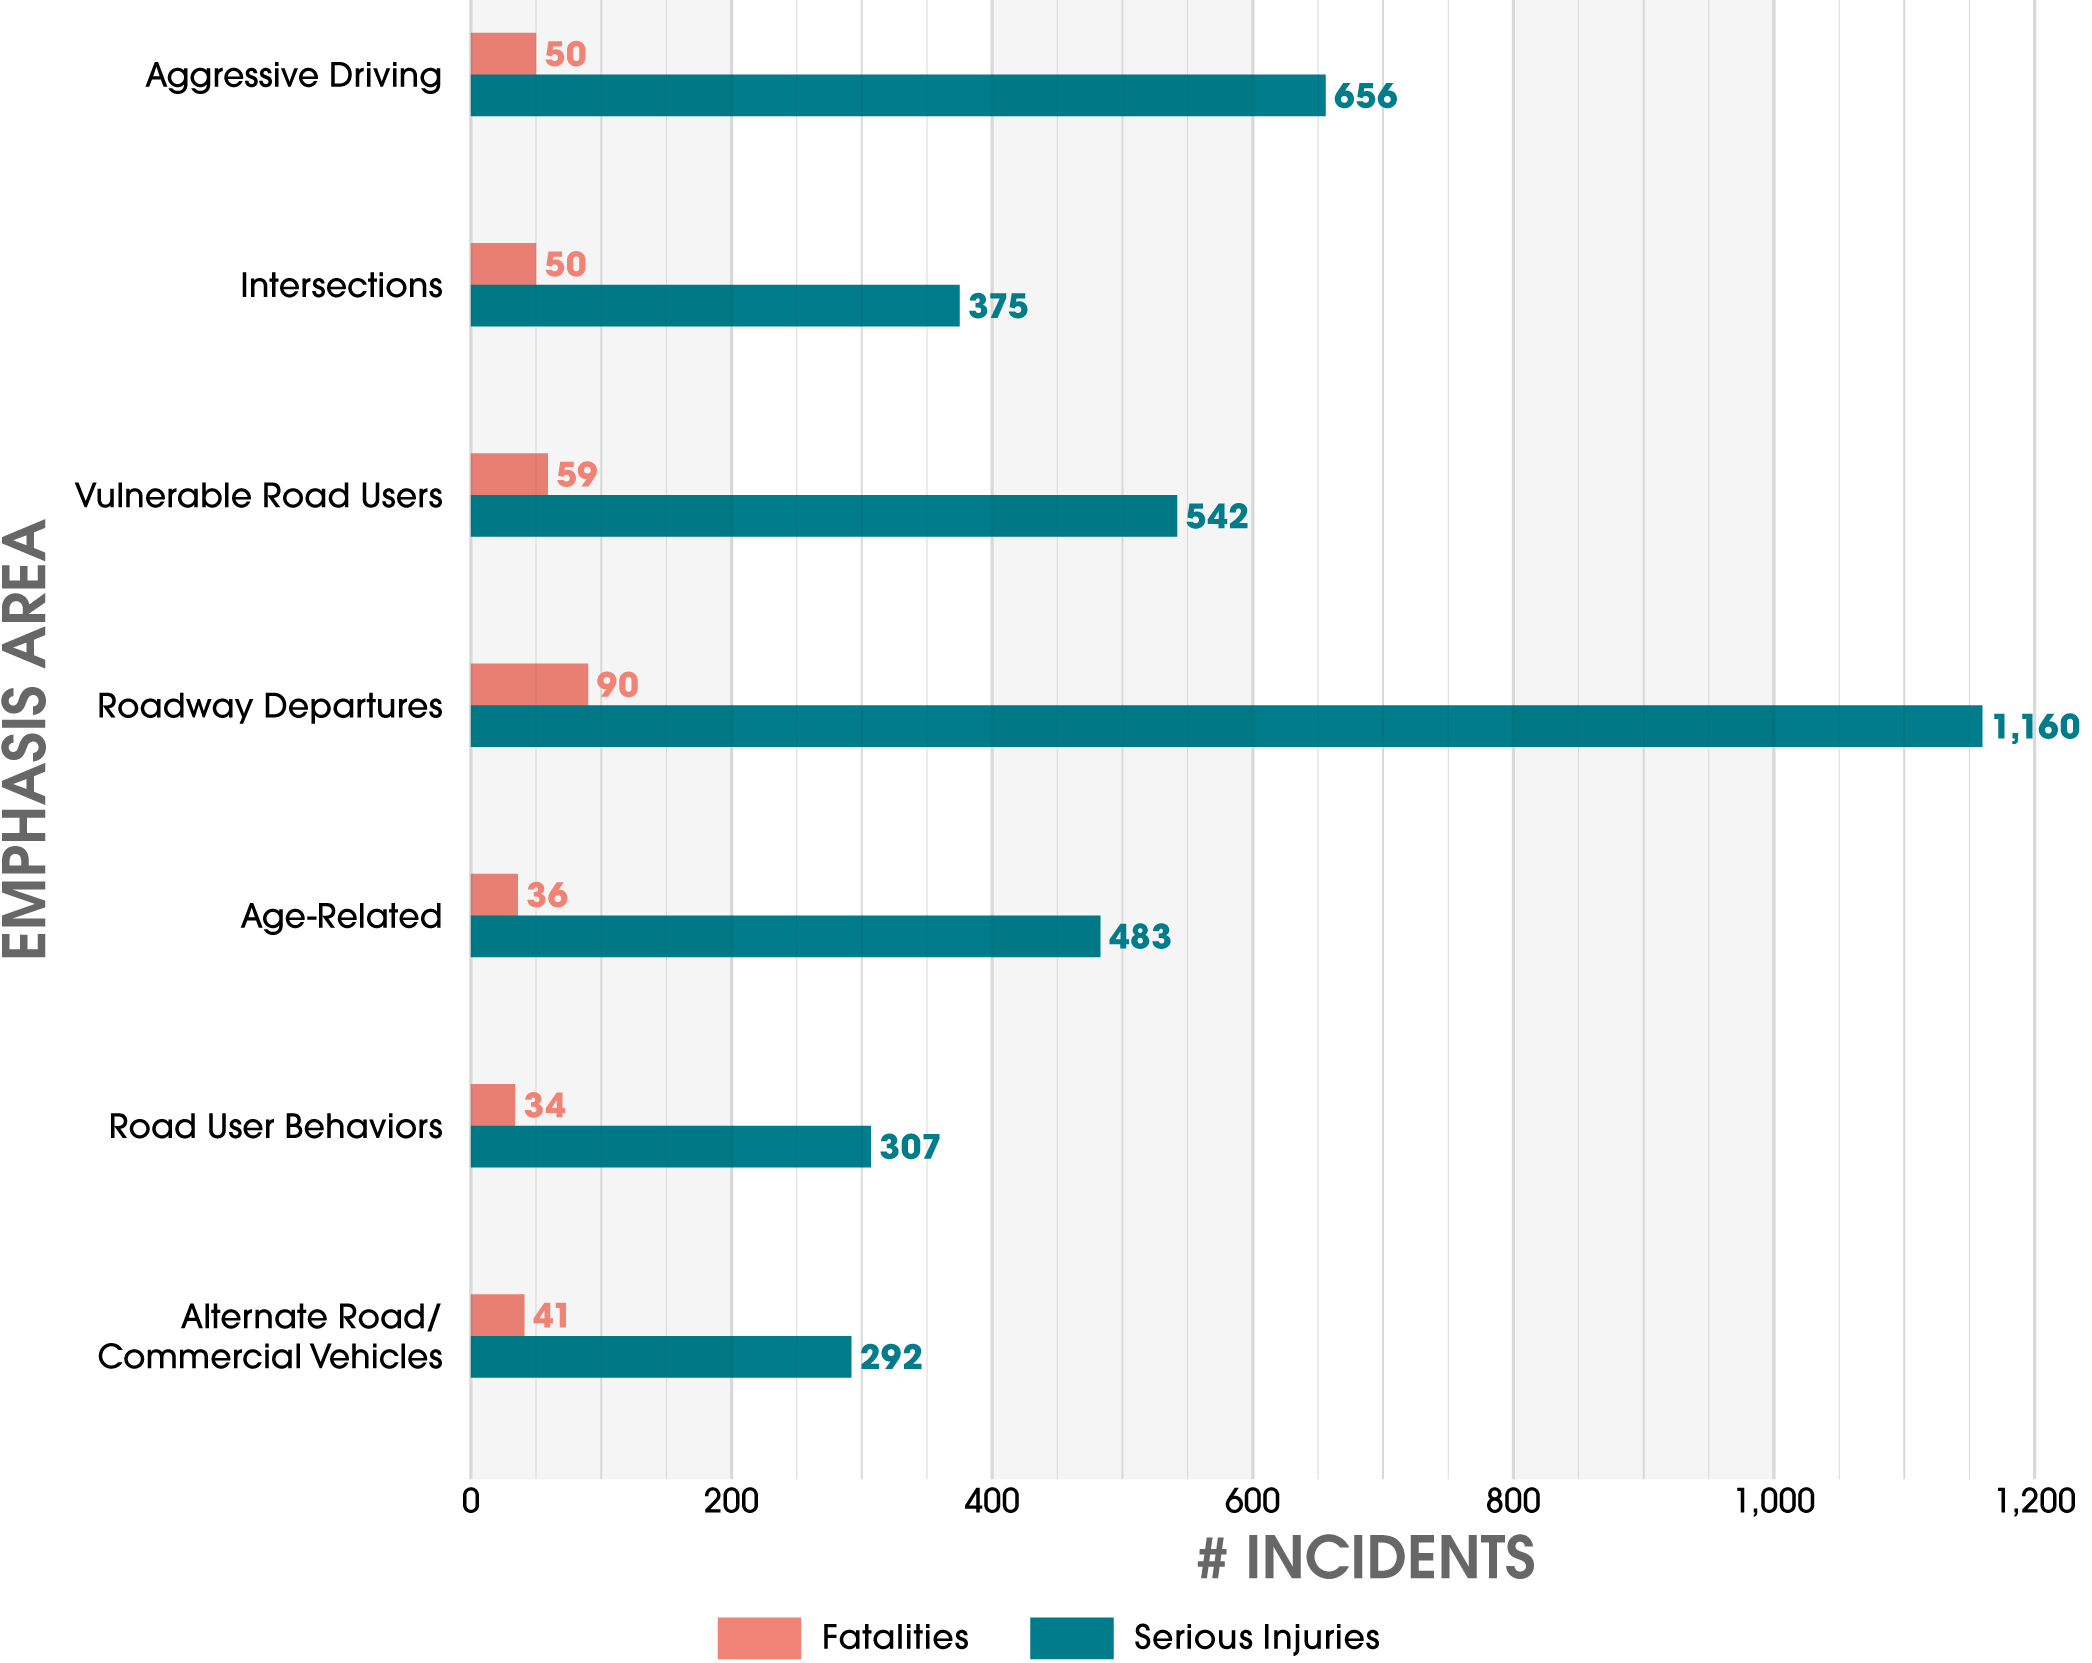
The leading crash type in both fatalities and serious injuries is roadway departure. Systemic safety infrastructure treatments are implemented statewide following the guidance of the New York Roadway Departure Safety Action Plan and are an effective strategy for reducing fatalities and serious injuries, especially those in roadway departure crashes. Similarly, UCTC will utilize infrastructure safety countermeasures systemically to address physical risk characteristics found on roadways where severe roadway departure crashes occur the most frequently as outlined in the 2023 UCTC Road Safety Plan.
Age-related crashes, which include crashes involving younger drivers (under 25 years of age) and aging drivers (64 and up) lead the way in contributing factors for both fatalities and serious injuries in the planning area.
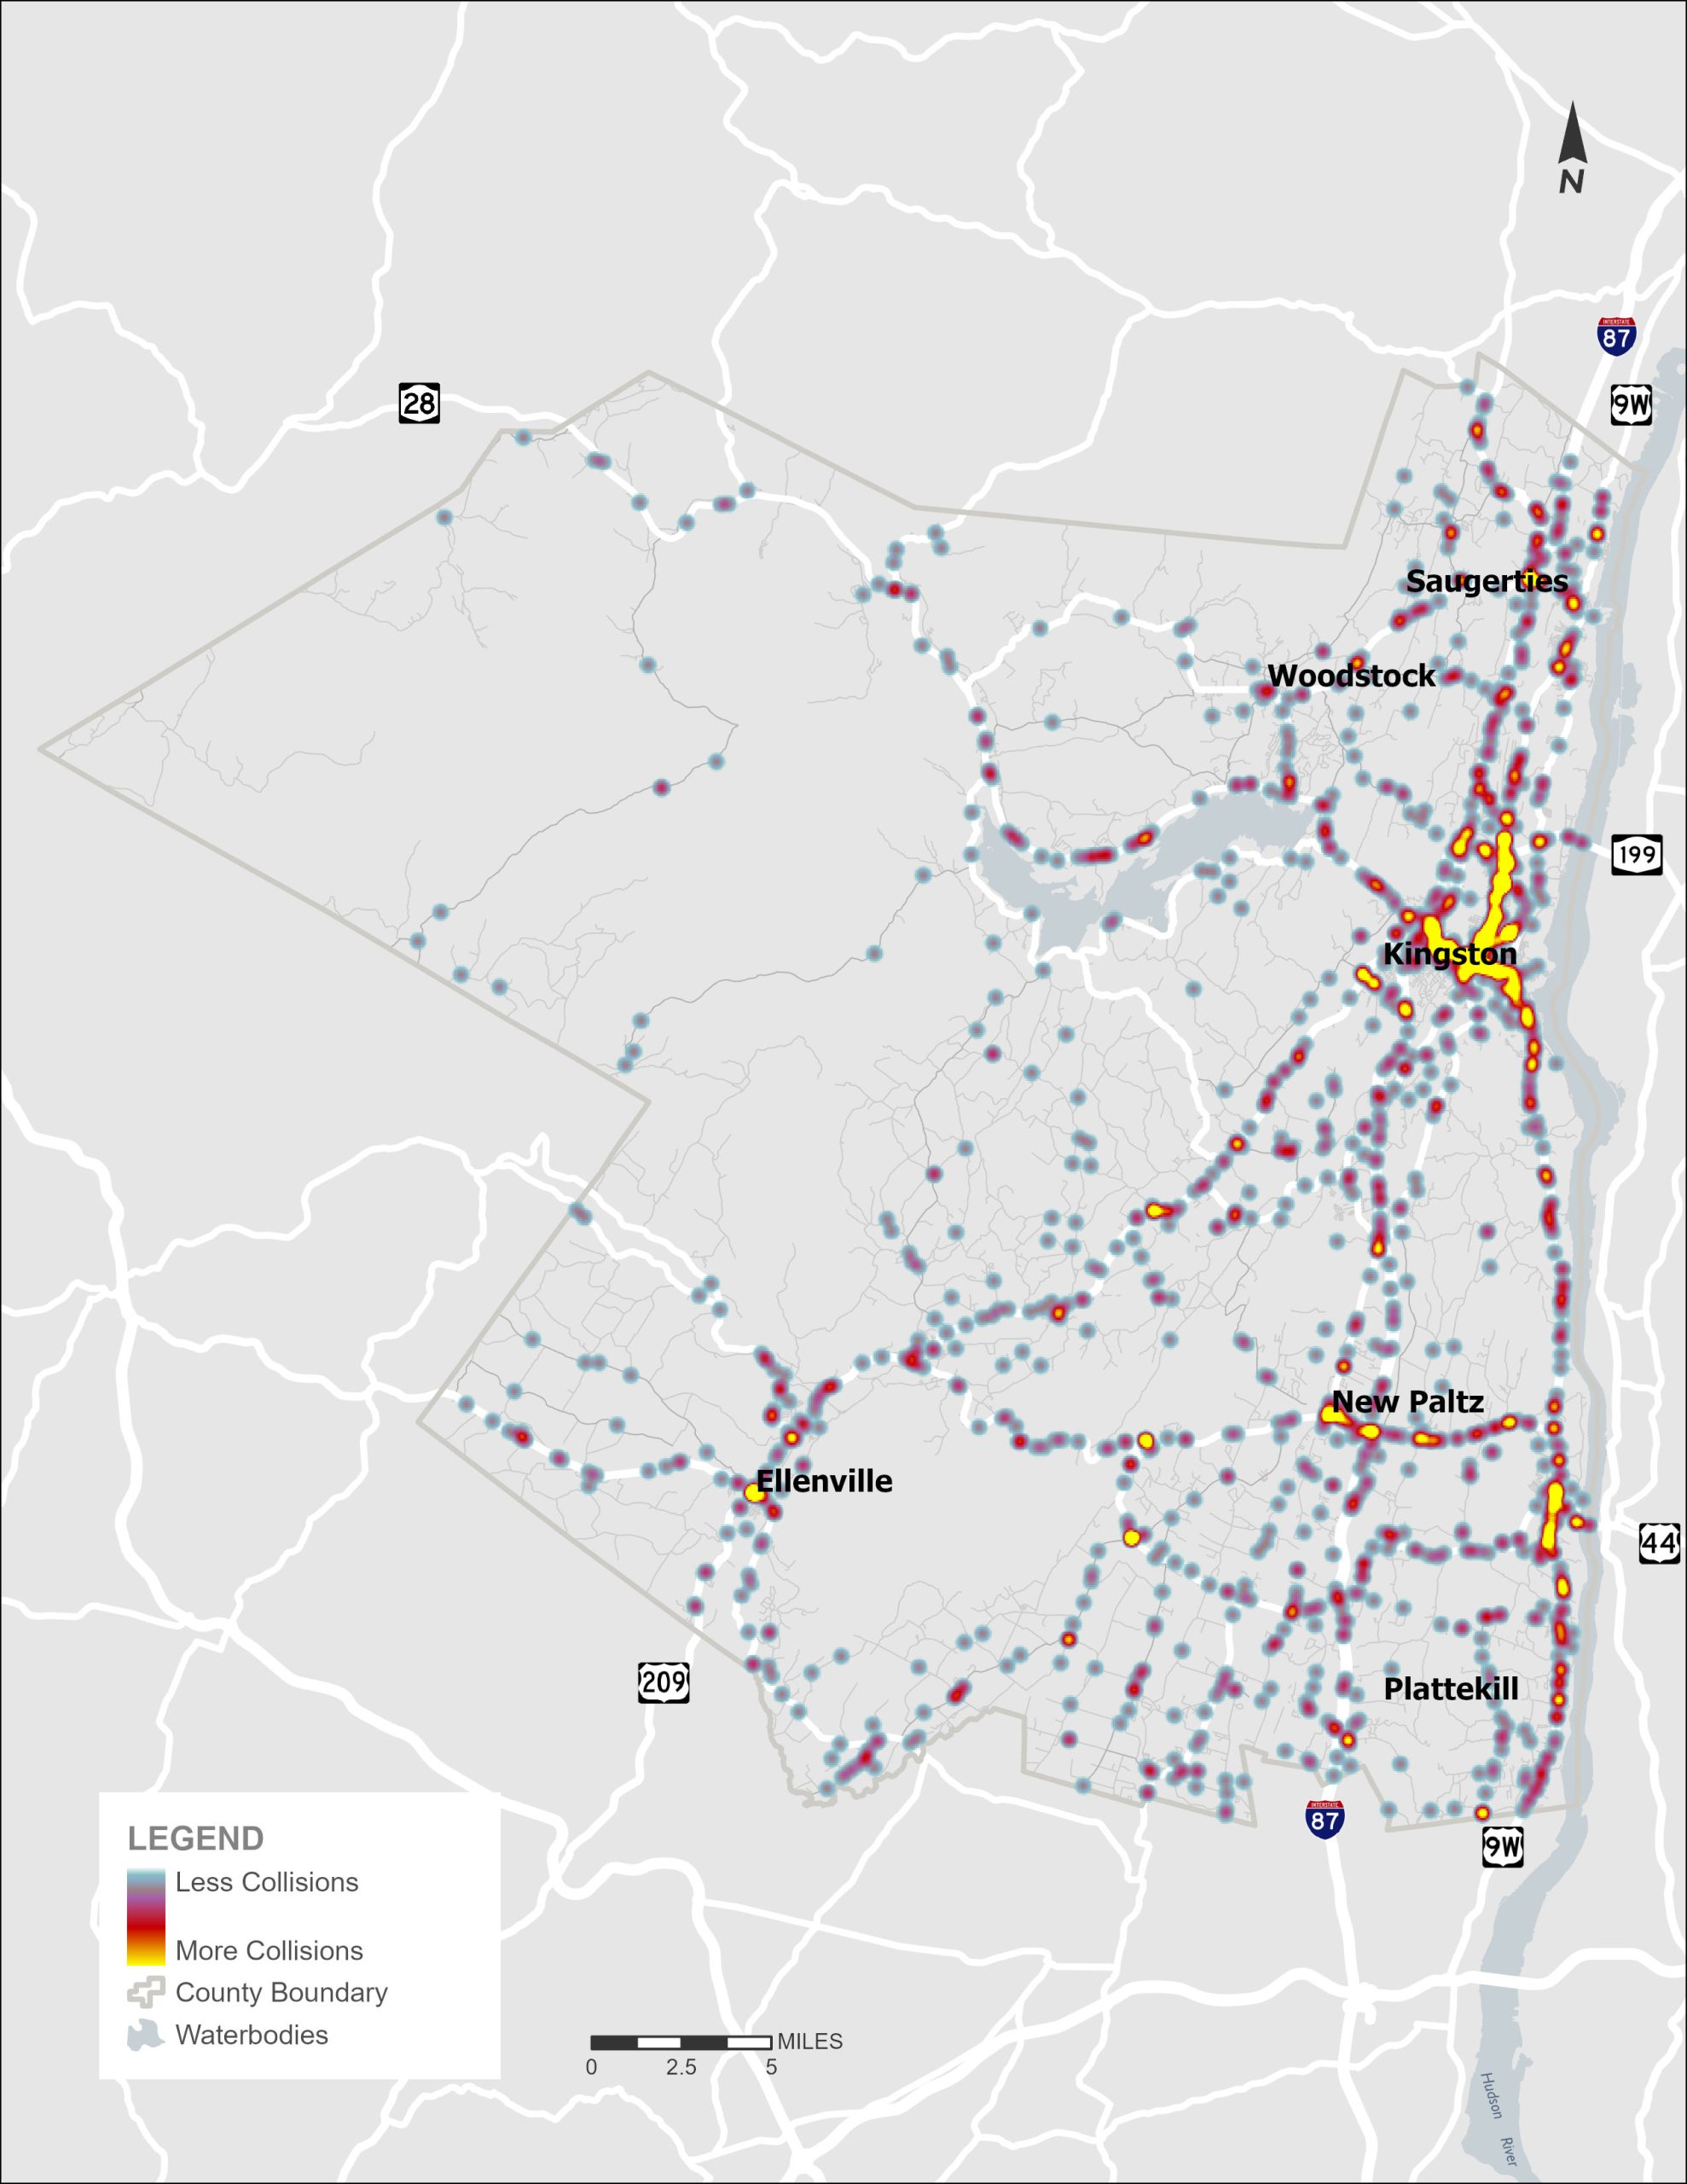
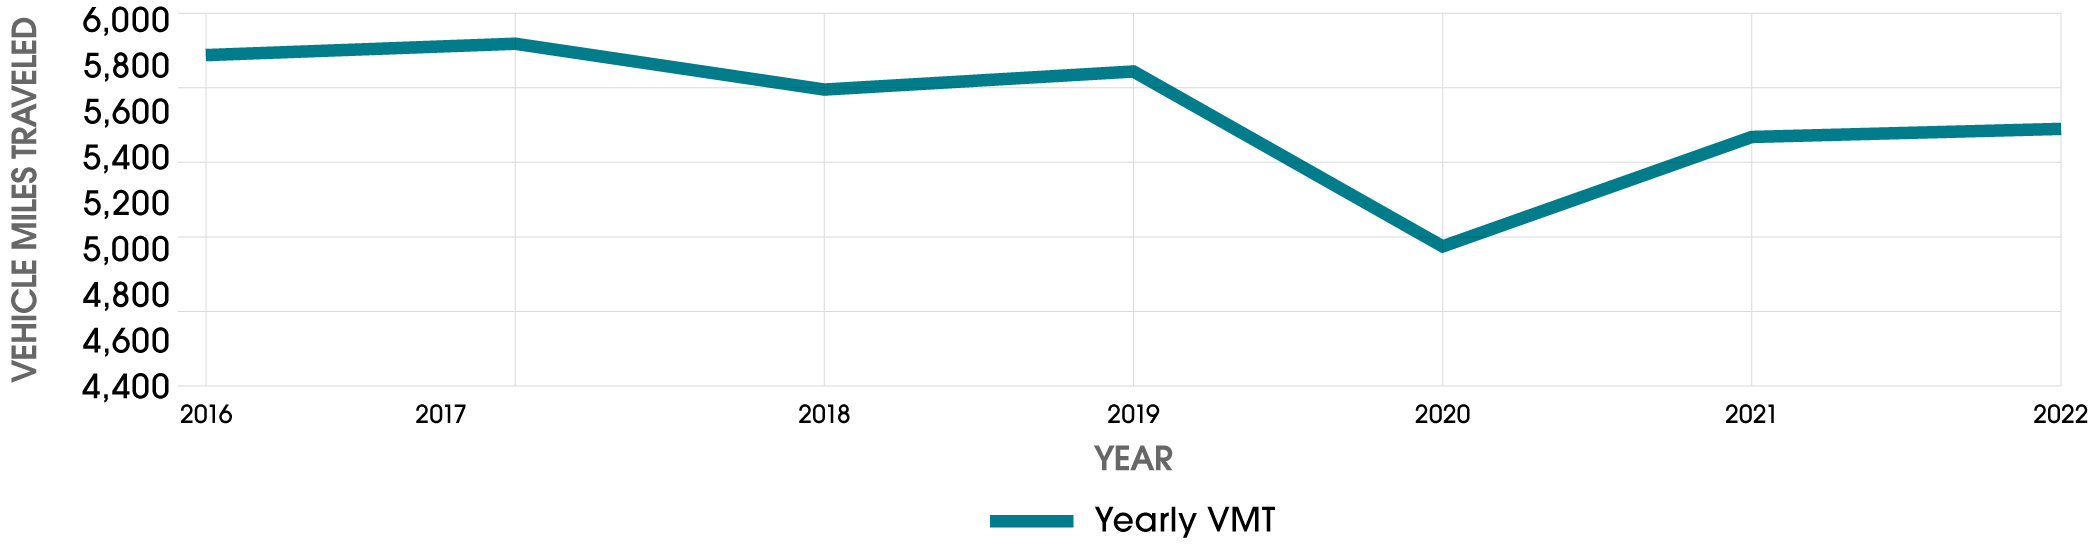
Crashes are generally clustered in the locations with highest vehicle miles traveled (VMT). The two largest municipalities in the county have the highest crash and injury totals: the City of Kingston and Town of Ulster.
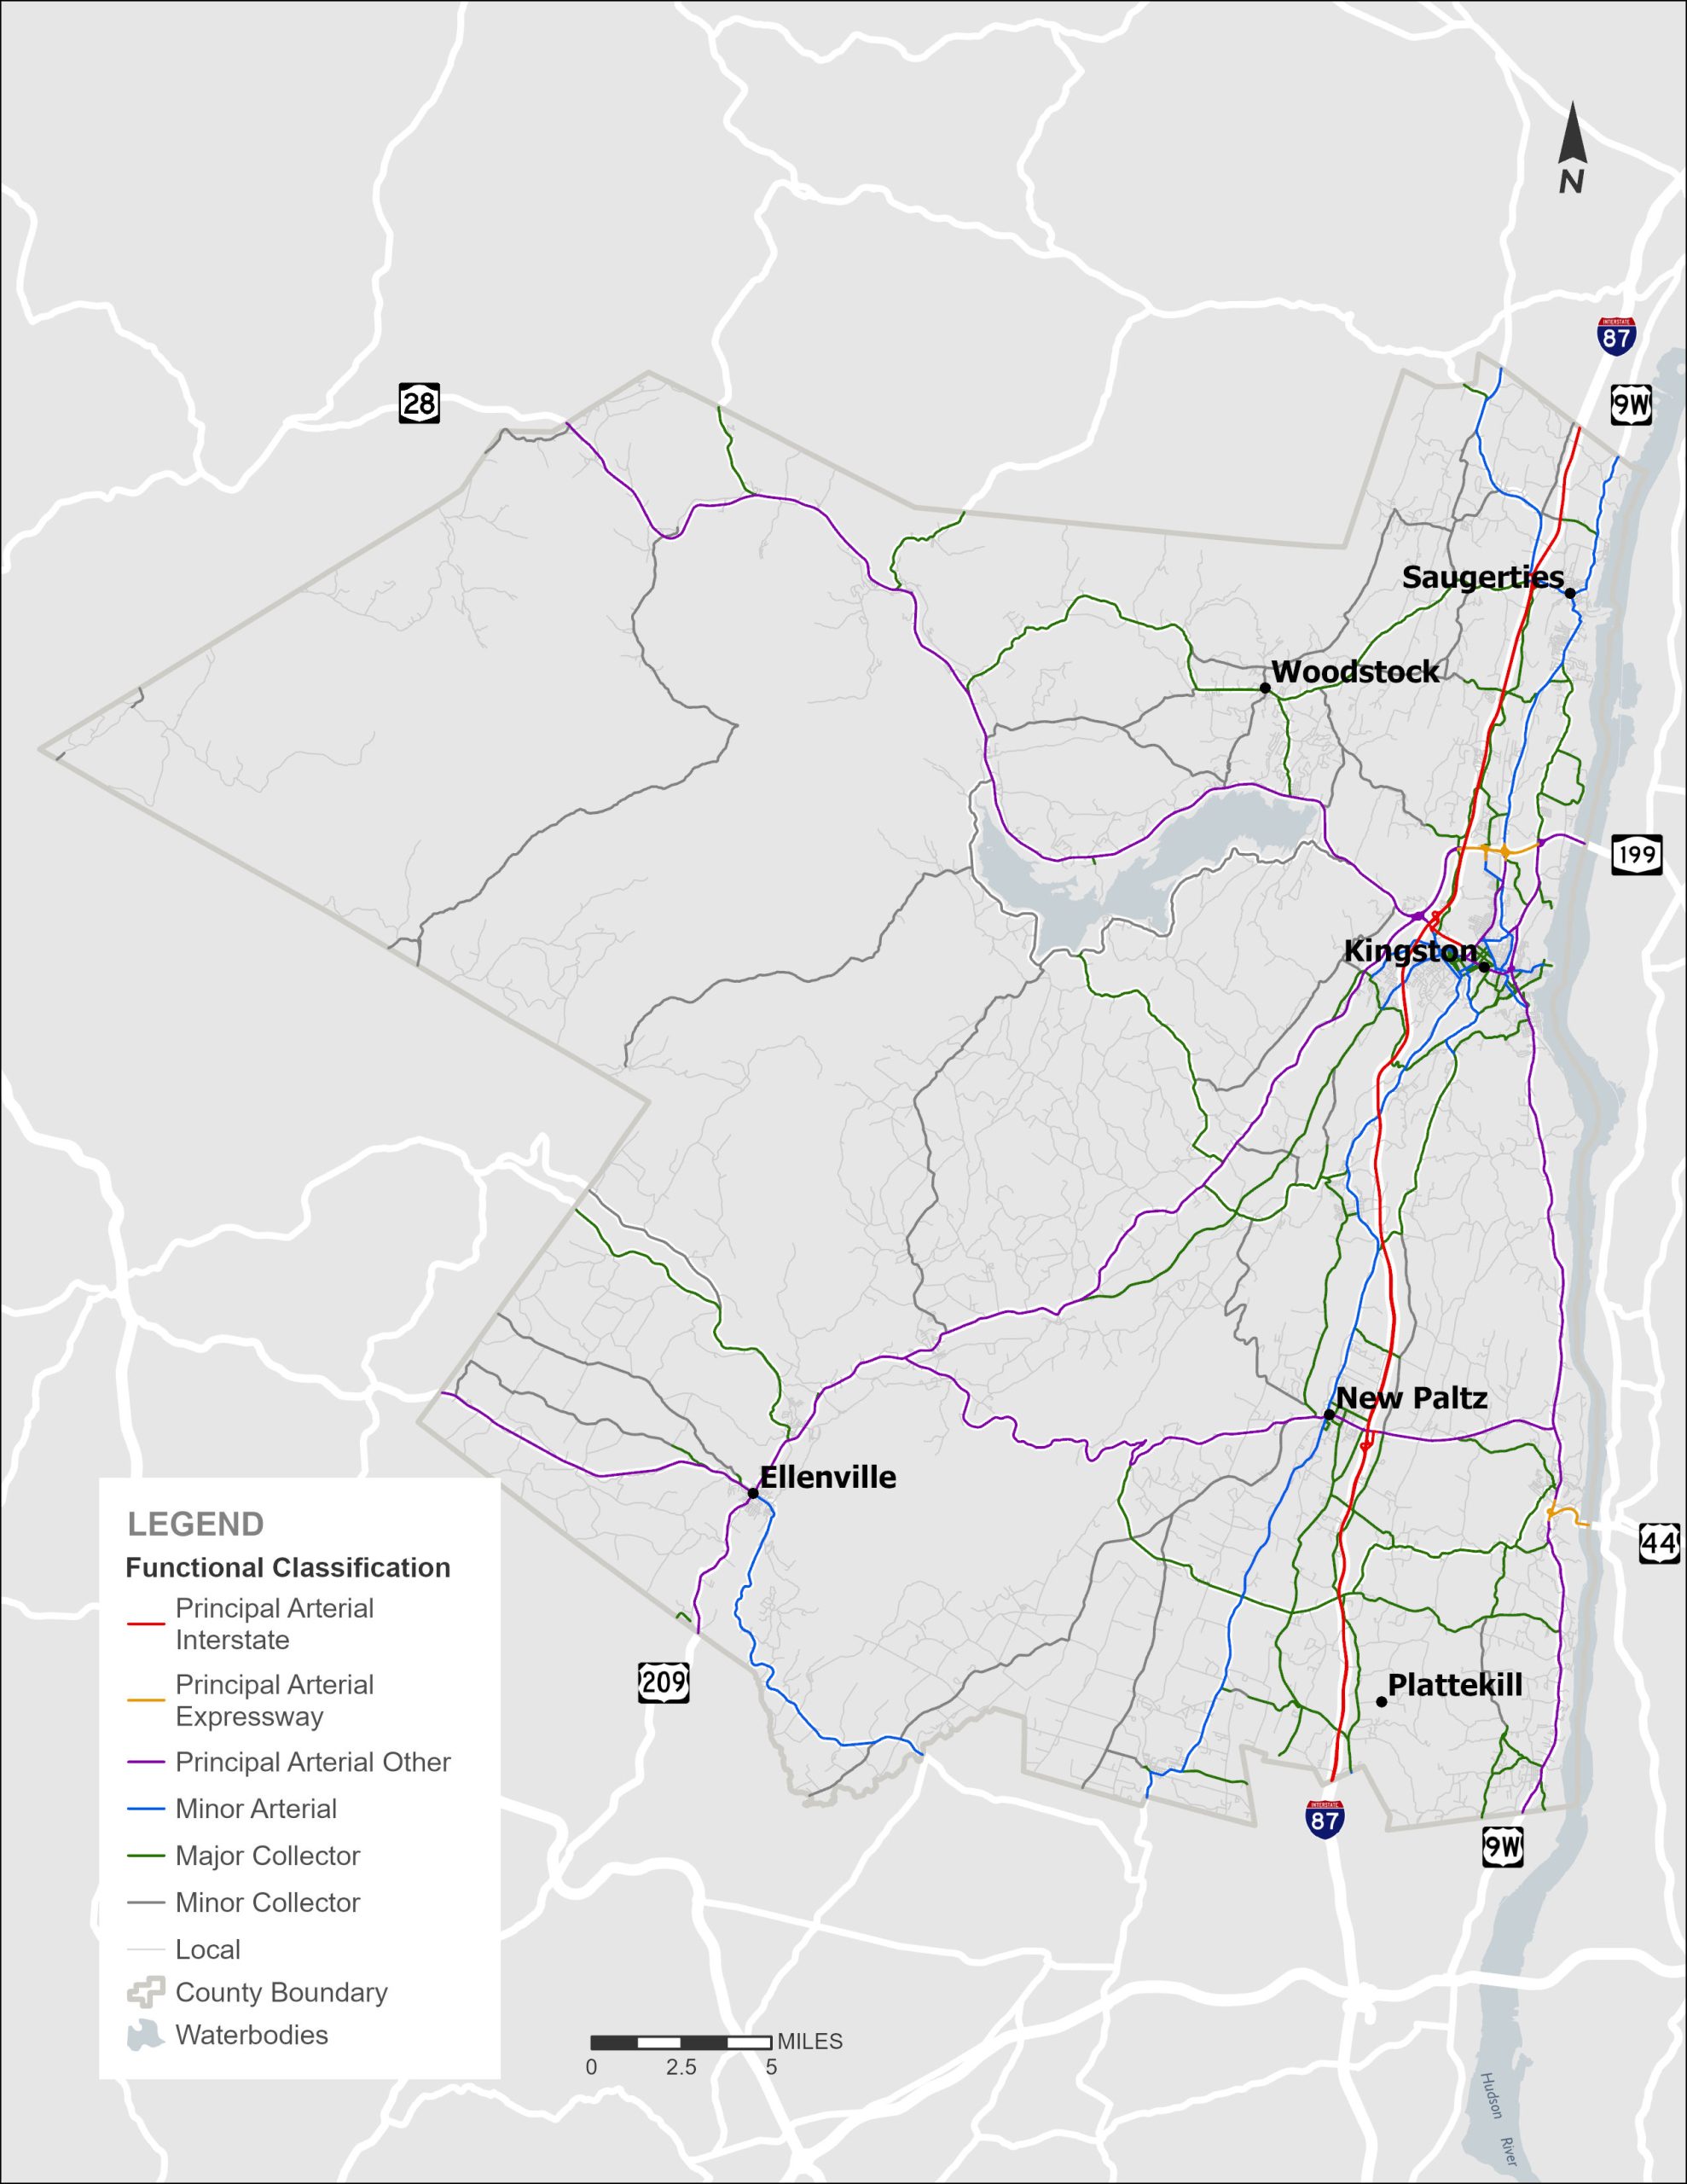
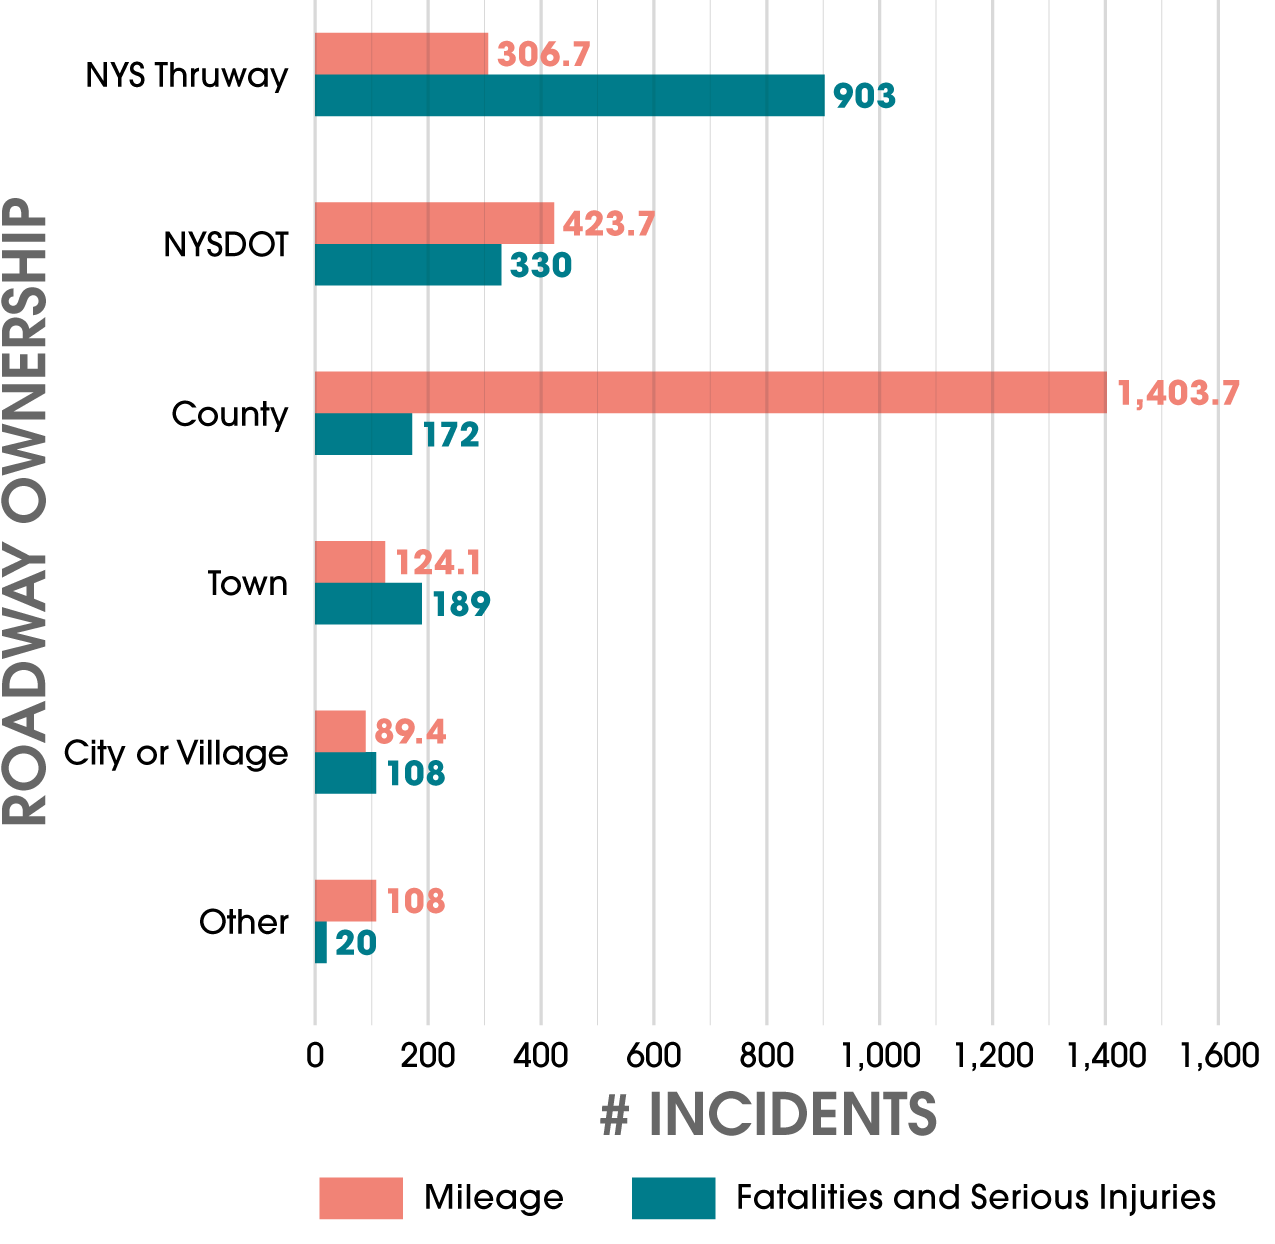
While most of the mileage in Ulster County is made up of locally-owned roadways, state-owned roadways contribute the highest total of fatalities and serious injuries. VMT, speeds and other factors do contribute to these totals.
Safety Project Spotlight: Broadway Streetscape Project
The Broadway Streetscape Project transformed the Broadway corridor between E St James Street to E Chester Street. From St James Street to Prince Street, the project includes a two-way protected bike lane in conjunction with a road diet, converting the roadway from two lanes in each direction to one lane in each direction with a center left turn lane. Additionally, the full project included new ADA accessible sidewalks, coordinated traffic signals, new traffic and wayfinding signage, bike racks, and sustainable landscaping. The project resulted in significant decreases in total crashes (71 total crashes in 2024 compared to the high of 141 crashes in 2018) and decreases in crashes resulting in fatalities or injuries (11 total crashes in 2024 compared to the high of 32 in 2018).
The Freight System
According to the 2023 ACS, approximately 92.5% of Ulster County households have access to one or more vehicles. The high accessibility of vehicles contributes to the high volume of drive-alone commuting by Ulster County residents. Ownership rates are much lower in urbanized areas.
Traffic Network Overview
Ulster County is served by a network of roadways ranging from interstate expressways to local town and village streets. Recent traffic volume counts and network analyses show that, for the most part, there is limited traffic congestion in Ulster County and travel within the region occurs without excessive delay.
Prior to the COVID-19 pandemic, Vehicle Miles Traveled (VMT) in Ulster County remained relatively steady. Consistent with statewide and national trends, VMT decreased precipitously in 2020 but has since rebounded. That said, VMT has not yet reached the peak levels observed in 2018.
Our transportation system has evolved from something that is static and provides a defined level of service to something that can be actively managed to optimize the level of service in real time. Technology, generally under the terminology of Intelligent Transportation Systems (ITS), has done a great deal to enable regional transportation system management and operations. Application of management and operations strategies can be grouped in these areas:
Traffic Management
Actively managing traffic flow results in more efficient mobility. This can be accomplished in a number of ways, including computer-controlled traffic signal systems which optimize signal timing, transit signal priority, reversible lanes, High Occupancy Toll lanes, and variable speed limits.
Incident Management
This requires promptly detecting the incident, both through 911 calls and use of closed-circuit television cameras and other devices, and accurately dispatching the appropriate emergency services resources. It also means response agencies, including police, fire, EMS, transportation or public works departments, and towing companies sharing standard operating procedures and training.
Traveler Information
There are a number of techniques and devices that are used to facilitate traveler information, including Dial 511 systems, dynamic or variable message signs, Highway Advisory Radio, and mobile apps such as Google Maps and Waze which collects data from smart phones to determine traffic conditions.
Electronic Toll Collection (ETC)
Systems like E-Z Pass® New York create multiple benefits, including speeding traffic flow through toll barriers, facilitating HOT lane pricing, and monitoring traffic flow through a series of roadside tag readers.
Commercial Vehicle Operations
This is a subset of ITS that is dedicated to making truck transport safer and more efficient. It involves such techniques as electronic verification of a truck’s credentials, weigh-in-motion, and electronic logbooks.
Other Management Systems
These include parking management systems which notify drivers of available parking spaces, port/terminal management systems which control the flow of trucks in and out of a facility, and Connected Vehicle technology which can send drivers active warnings of pedestrians waiting to cross the street.
Congestion Management Process
Congestion continues to be an issue that UCTC has worked to measure and define, locate, manage, and integrate and evaluate in the planning process. The Congestion Management Process (CMP), last completed in 2019, conducted macro analyses to identify key congested areas in the region on the National Highway System (NHS). These areas were identified using a number of congestion measures including Level of Travel Time Reliability (LOTTR), Truck Travel Time Reliability (TTTR), Travel Time Index (TTI), and Total Excessive Delay per Mile (TED/mile). Each of the congestion measures – LOTTR, TTTR, TTI, and TED/mile – employs a threshold of acceptability for road segments on the NHS. Table 5.10 provides a summary of NHS roadways in the Mid-Hudson TMA and their relation to the threshold values for the identified congestion measures.
Based on 2018 data, 94% of Traffic Message Channels (TMCs) that meet the data completeness threshold ‘passed’ the peak period congestion (TTI) threshold of 2.0. For reliability (LOTTR), 89% of segments ‘passed’ the threshold of 1.5, while 90% of segments ‘passed’ the threshold of 40,000 for total congestion (TED/mile), and 95% of interstate segments ‘passed’ the threshold of 3.99 for truck reliability (TTTR). Because many of the failing segments are small fragments near intersections and interchanges, the percentage of roadway miles that pass these thresholds is even higher. The majority of the roadway mileage that does not meet the threshold values in the TMA occurs outside of the UCTC planning area. Figure 5.28 provides the locations of segments not meeting the thresholds set out in the CMP.
In addition to the threshold analysis, the CMP also established a list of Priority Analysis Locations of the worst performing segments in the TMA for further review.