6. Transportation and the Environment
6. Transportation and the Environment
It is incumbent on UCTC to broadly consider the potential environmental impacts of the actions proposed in the long-range transportation plan, and programmatic means to mitigate those impacts. There are many different types of environmentally sensitive areas and potential impacts to the natural and human environment that may be affected by various actions associated with the 2050 LRTP.
These include (but are not necessarily limited to):
- Threatened and Endangered Species
- Wetlands
- Floodplains
- Surface and Ground Waters
- Stormwater Management and Erosion and Sediment Control
- Hazardous Materials
- Litter and Odors
- Air Quality
- Historical/Cultural Resources
- Right-of-Way/Property Impacts, Including Impacts to Parks, Farmland and Neighborhoods
- Scenic Viewsheds
- Traffic and Train Noise
- Extreme weather events
Mitigation of Transportation Impacts on the Environment
The federal National Environmental Protection Act (NEPA) and NYS’s Statewide Environmental Quality Review (SEQR) and many other State and federal environmental regulations, require that environmental considerations be addressed in transportation decision making, plans and programs. Lead agencies and project sponsors in charge of transportation projects and MPOs must strive to ensure full and objective consideration of all reasonable alternatives that avoid adverse impacts to the environment and communities. Where adverse impacts are unavoidable, lead agencies and project sponsors must identify the impacts and incorporate measures to mitigate impacts to the maximum extent practicable.
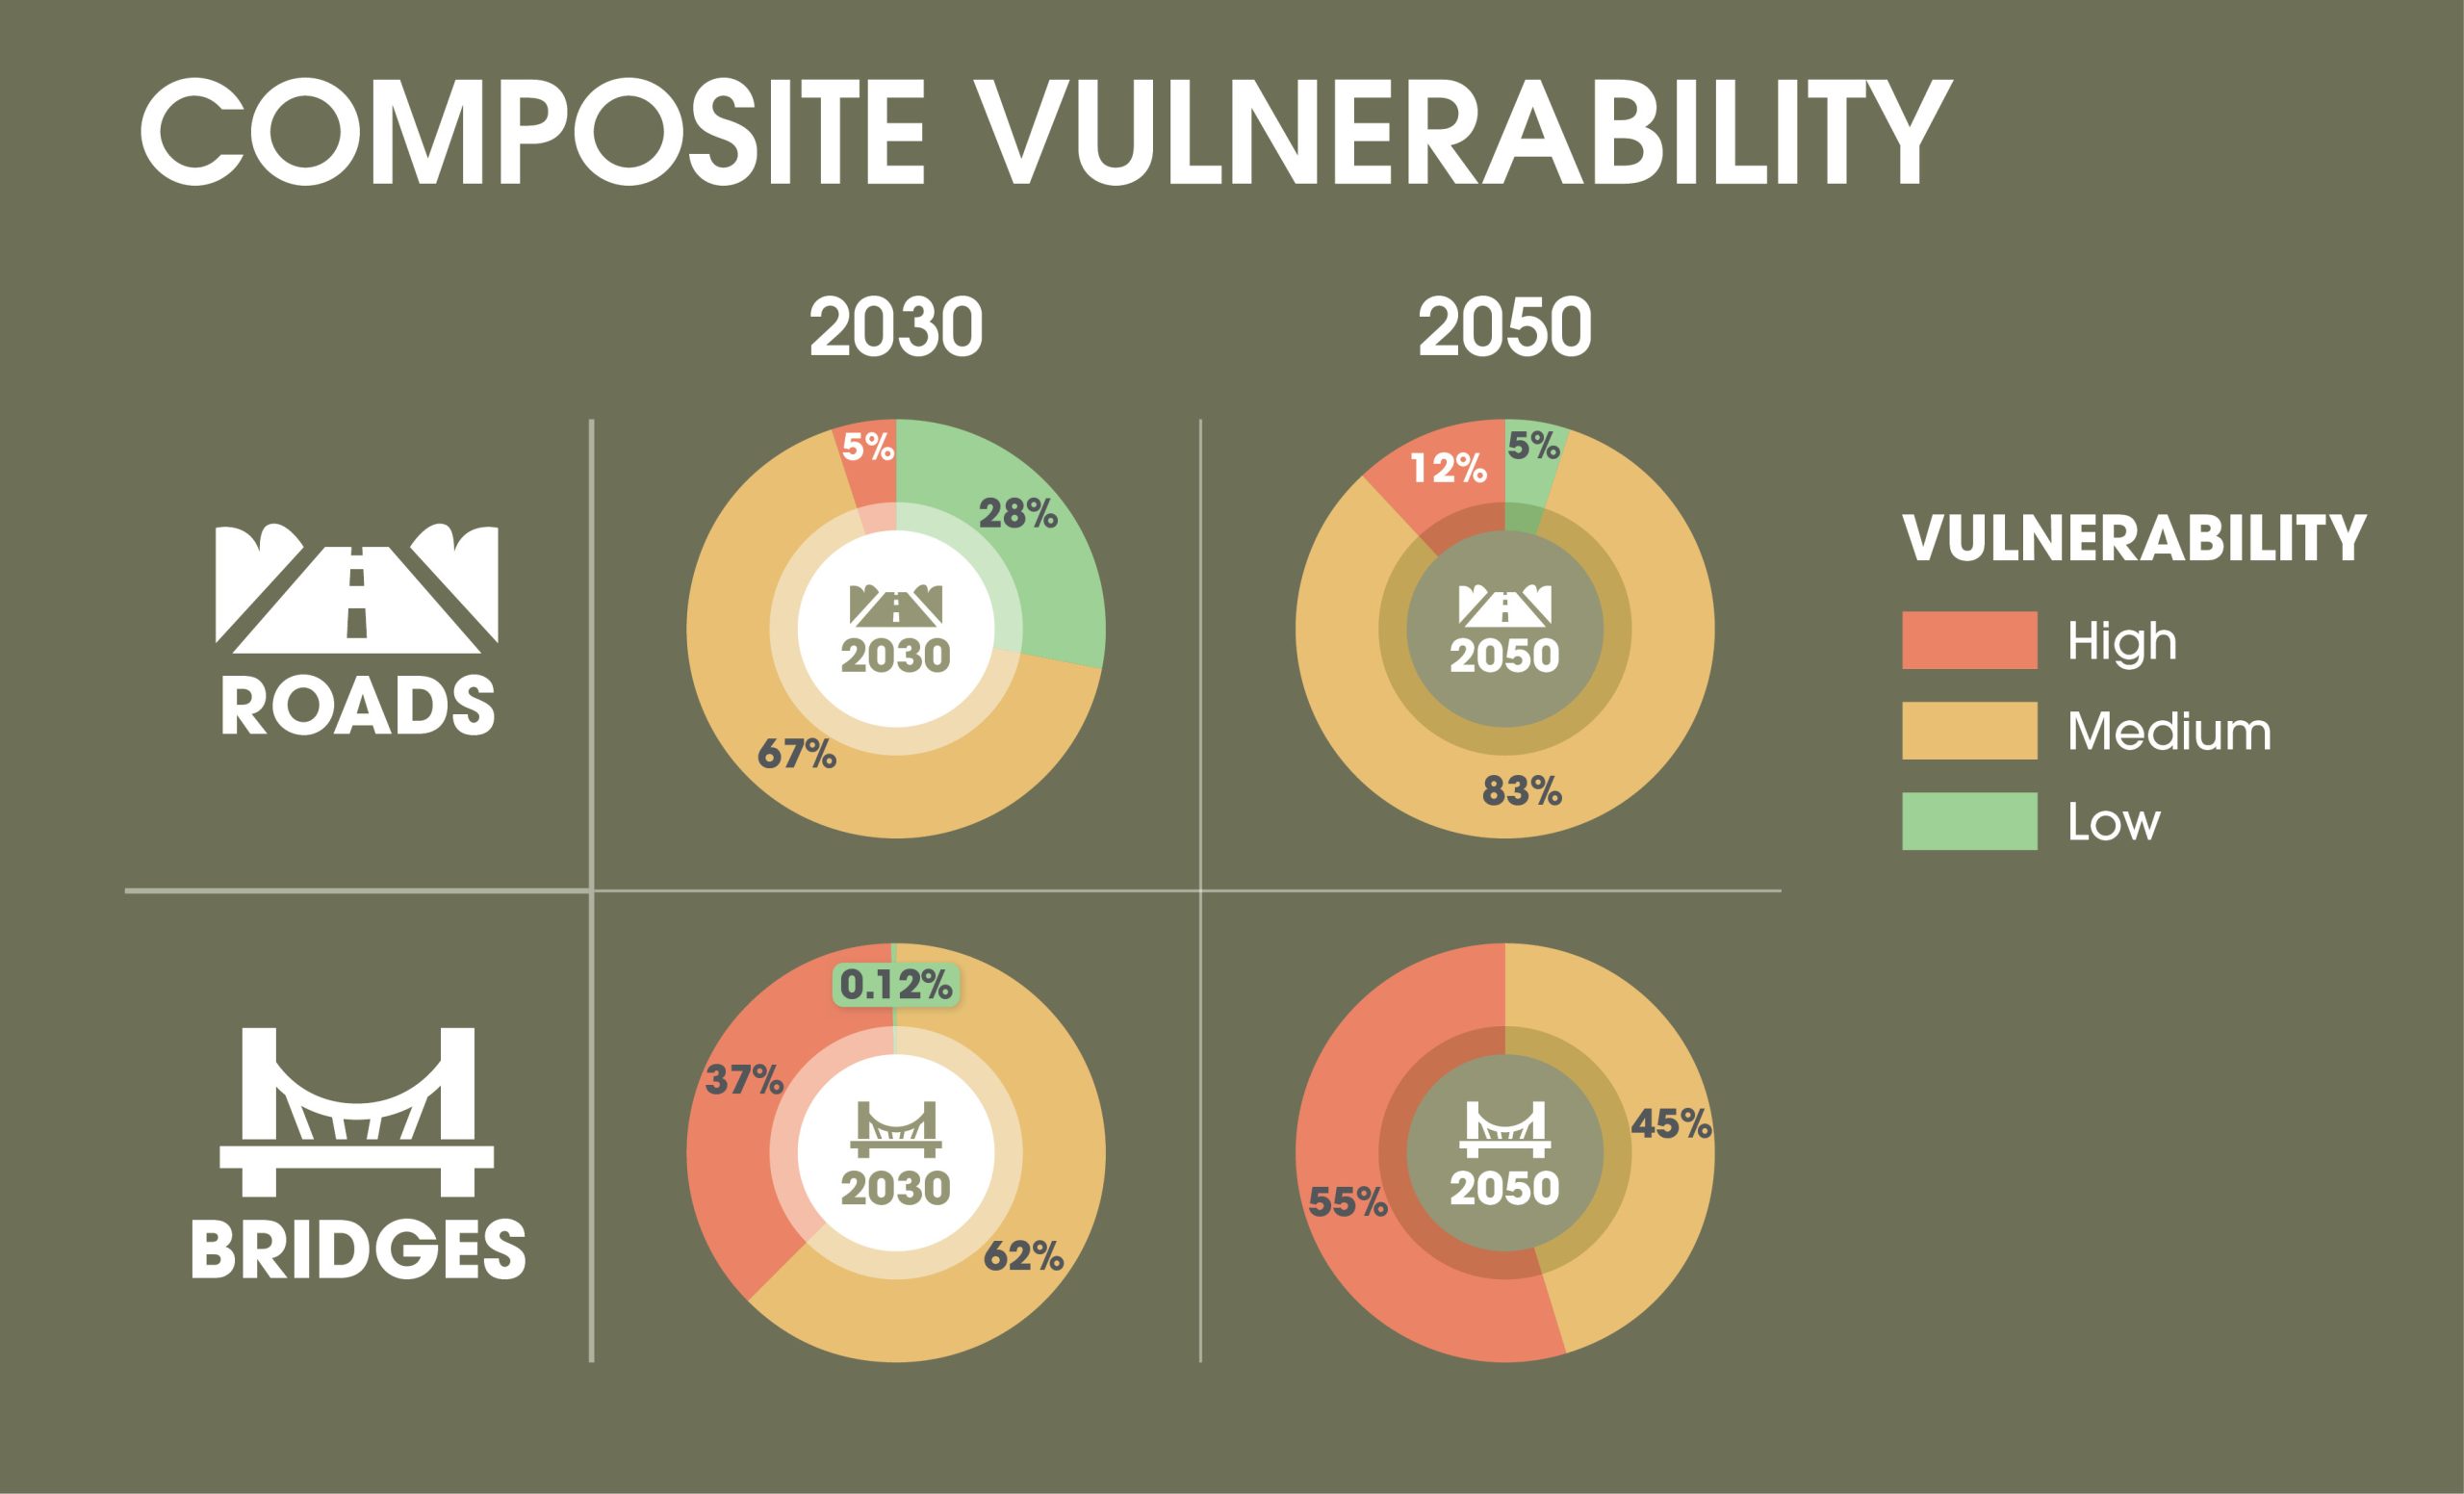
Vulnerability Assessment
UCTC initiated the Vulnerability Assessment to address the vulnerability of critical surface transportation infrastructure elements to hazards, defined as the degree to which a system is susceptible to, or unable to cope with adverse effects of extreme weather events. In the transportation context, it is a function of transportation asset’s exposure (the likelihood of an asset to be subjected to climate stressors), sensitivity (how an asset responds to or is affected by exposure to climate stressors) and adaptive capacity (how easily/quickly a disrupted asset can be restored or resume normal operations).
The results show that from 2030 to 2050, an increase is projected in the medium and high vulnerability range for both roads and bridges. Bridges are set to see a particularly large increase in deck area square footage that would fall in the high vulnerability range, going from 37% in 2030 to 55% in 2050. The increase in high vulnerability is less for roads with the percentage only going up to 12% from 5%. This study further highlights the need to incorporate sustainable transportation design into future bridge and roadway projects.
Sustainable Transportation
Sustainability is defined as “development that meets the needs of the present without compromising the ability of future generations to meet their own needs.” The concept known as the “triple bottom line” functions as the predominant theory addressing sustainability in practice. Triple bottom line (TBL) accounting expands the traditional reporting framework to consider not only financial performance, but also environmental and social performance, and explicitly accounting for life-cycle costs.
Sustainable transportation is achieved through a variety of mechanisms at programmatic and project levels. Sustainable transportation is achieved through a variety of mechanisms at programmatic and project levels. On a programmatic level, it includes adherence to federal aid procedures for projects, in particular, federal and state permitting and environmental review processes. It also includes serious evaluation of the need for new facilities in the first place, seeking to avoid unnecessary investments and their possible negative longterm impacts. On a project level, it involves the integration of innovative approaches that mitigate or diminish negative impacts on the environment into the design and construction process.

Reducing Air Pollution
Ambient air quality in the U.S. is regulated through the National Ambient Air Quality Standards (NAAQS), which were established by the Clean Air Act and are overseen by the federal Environmental Protection Agency (EPA). Most air pollution monitored under the NAAQS is due to combustion of fossil fuels, much of which comes from the transportation sector.
According to the US Census bureau, 71% of people employed in Ulster County travel to work alone. Private vehicle commuter travel (primarily in cars and SUVs) accounts for a total of 78% of trips to work, further underscoring the impacts that cars and SUVs have on air pollution in Ulster County.

Electric Vehicles
In addition to policies that encourage drivers to leave their cars at home and seek alternatives to single-occupancy motor vehicle travel, solutions that make those vehicles cleaner to use (i.e. reduce air pollution) must be deployed if further tangible reductions in key pollutants are to be achieved. Electric vehicles have the potential to contribute, and despite currently accounting for a small fraction of vehicles in Ulster County (under 2% or approximately 2,000 vehicles, see Figure 6.2), there are other parts of the Hudson Valley where EV adoption has grown more rapidly. (e.g. Westchester County, see Figure 6.3).


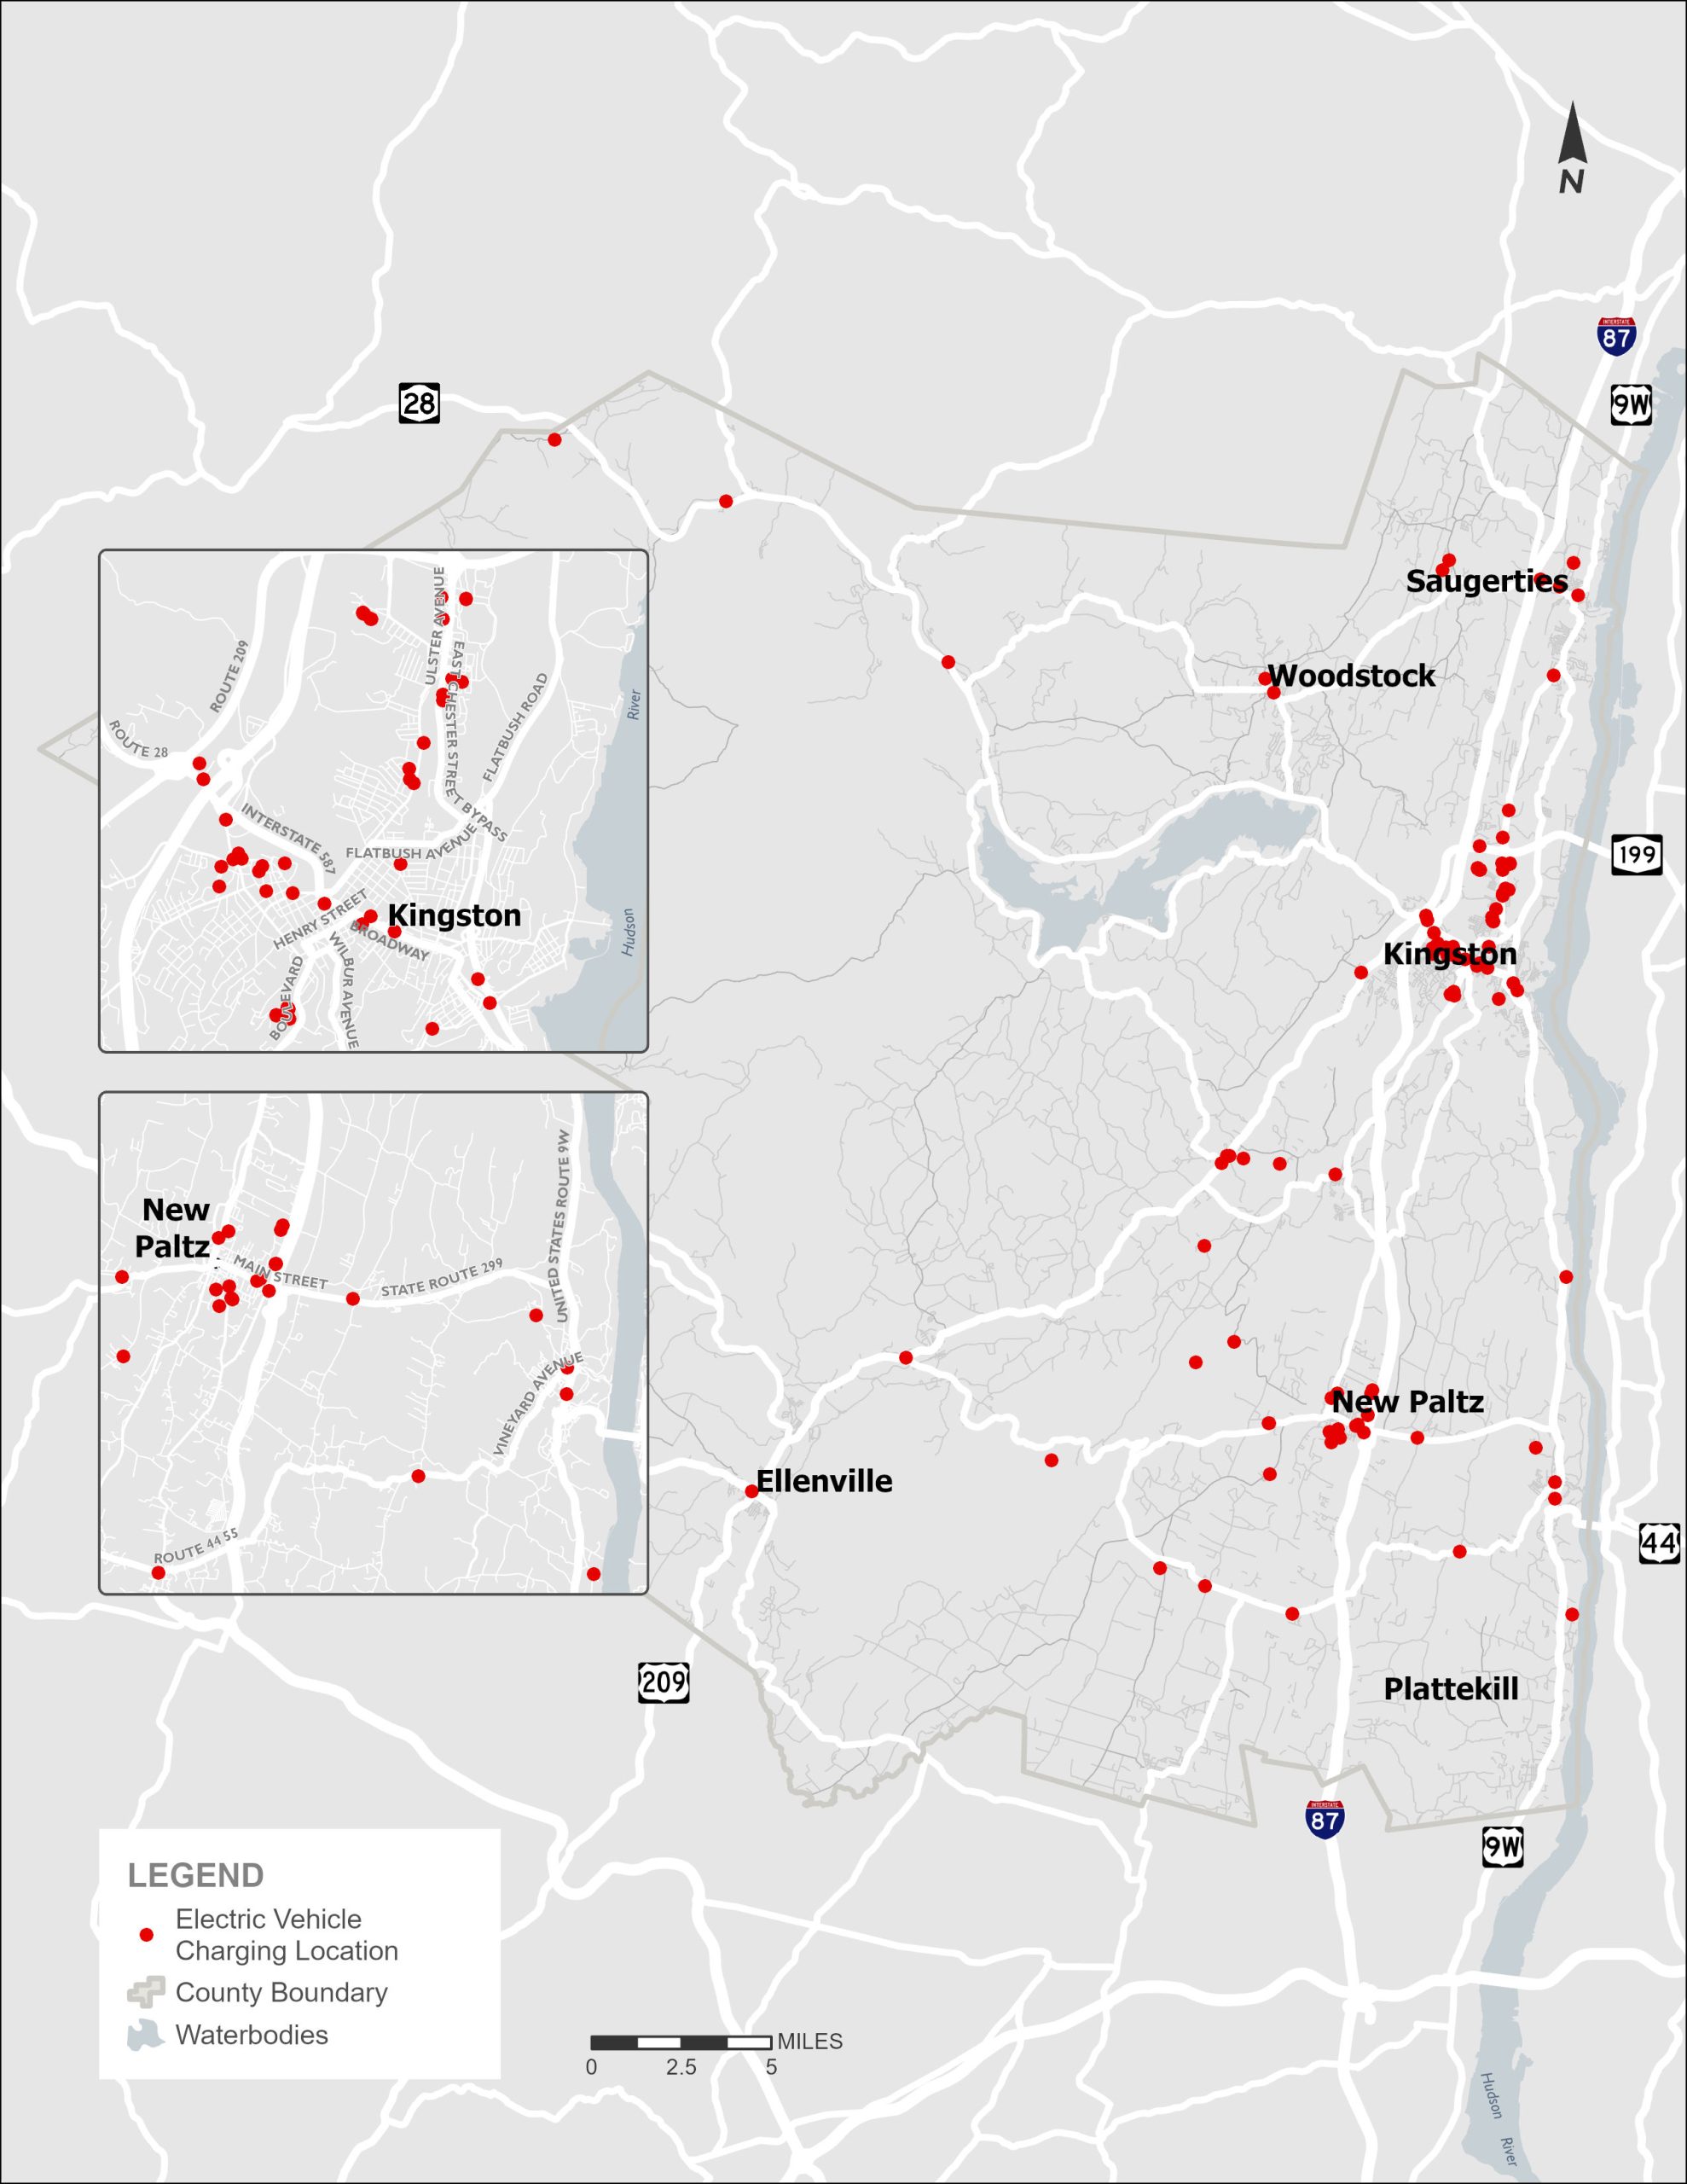
While the total number of registered EVs in Ulster County is relatively small compared to all vehicles, the pace of growth has increased considerably. As shown in Figure 6.4, the number of new EVs registered each year in the county has nearly quadrupled between 2020 and 2024. Over time, while it is expected that EV adoption continues to increase, the rate of change and share of EVs may depend on economic conditions, state and federal financial incentives for purchase, fuel costs, EV range per charge, and proximity to EV charging stations (shown in Figure 6.5).

Transportation Resilience
What is Transportation Resilience? The ability to prepare for changing conditions and withstand, respond to, and recover rapidly from disruptions. In addition to impacting the environment, the transportation sector is impacted by the environment, and one very important mechanism for this is through the destructive effects of extreme weather events. Adaptation seeks to address anticipated potential future changes resulting from extreme weather, notably in Ulster County in the form of intense flooding and heat waves. Within Ulster County, there are over 40 miles of tidal coastline in the Hudson River Valley that is subject to impacts from inundation from the Hudson River. There are also numerous rivers and streams aside from the Hudson River that are also prone to flooding.
Given the long life span of transportation assets, planning for system preservation and safe operation under current and future conditions constitutes responsible risk management, a concept addressed through transportation resiliency planning. Resiliency requires a system-wide approach to providing transportation services before, during, and after an event.
Table 6.1 presents possible measures to make the Ulster County transportation system more resilient and sustainable.
Table 6.1 Possible Measures to Reduce Impacts of the Transportation Sector and Improve the Transportation System for All Users
Electrification (Buses & Freight) | Electrification (Personal Vehicles) | Sustainability Planning | Regulatory Incentives | Affordability | Driver Pricing Reforms/Cost Incentives | Infrastructure Improvements | Public/Alt. Transportation Options |
Port Equipment Electrification | Rebates & Tax Incentives | Transit-Oriented Development and In-fill Development | Real Estate Level of Service Review | Income-Based Transit Fares; Discounts for kids, seniors | Dynamic Parking Prices | State-of-Good-Repair Improvements for Roads | Expansion of Transit Service to Underserved Areas |
Electrify Local Delivery Vehicles | EV Charging Infrastructure Incentives | Non-road Equipment (Farms, Construction, etc.) | Transit Oriented Zoning | Direct Rebates/ Dividend | Congestion Parking | State-of-Good-Repair Improvements for Transit | Rural Public Transportation |
Electrify Transit Bus Fleets | Electrifying Carshares/ Rideshares | Adjusting Routes to Avoid Traffic | Transportation Demand Management | Financing Programs for EVs | Weight Distance Fees | Complete Streets | Carsharing and Bikesharing |
Electrify School Buses (V2G Potential) | Carpool Lane Access for ZEV’s | Resilient Transportation Infrastructure | Road Safety Liability | Telework | Parking Pricing and Parking Cash Out | Bond Measures | Rideshare and Vanpools |
Zero-Emission Fleet Commitment | Public Awareness Programs | Active Transportation; Community Planning | Tax Credits | Occupancy and High Traffic Pricing | Bike Facilities/ Amenities | Employer-sponsored Transportation | |
Heavy-duty EV Utility Rate Design Reform | Vehicle Retirement Incentive Programs | Pay as You Drive | Traffic Calming | Bus Rapid Transit & Express Bus Routes |
Note: Measures shaded in green indicate those that have been advanced within Ulster County https://www.dec.ny.gov/docs/administration_pdf/climtranslides081519.pdf